March 14, 2022
Paul Laursen, Bence Tamas and Andrea Zignoli
Our latest technical release includes vastly improved bike and run performance profile charts. Improvements have been made from both a visual standpoint, as well as under-the-hood work, resulting in clearer charts with more robust and accurate estimations of your performance potential. These bike and run performance-duration profiles (Figures 1 and 2) depict your performance potential […]
Our latest technical release includes vastly improved bike and run performance profile charts. Improvements have been made from both a visual standpoint, as well as under-the-hood work, resulting in clearer charts with more robust and accurate estimations of your performance potential. These bike and run performance-duration profiles (Figures 1 and 2) depict your performance potential (power output or speed) over the range of meaningful durations for your sport, and are attained conveniently as you go about your regular monitored training on Athletica. In this way, Athletica achieves a form of ‘invisible monitoring’ or ‘invisible testing’ for you as you go about your day-to-day business.

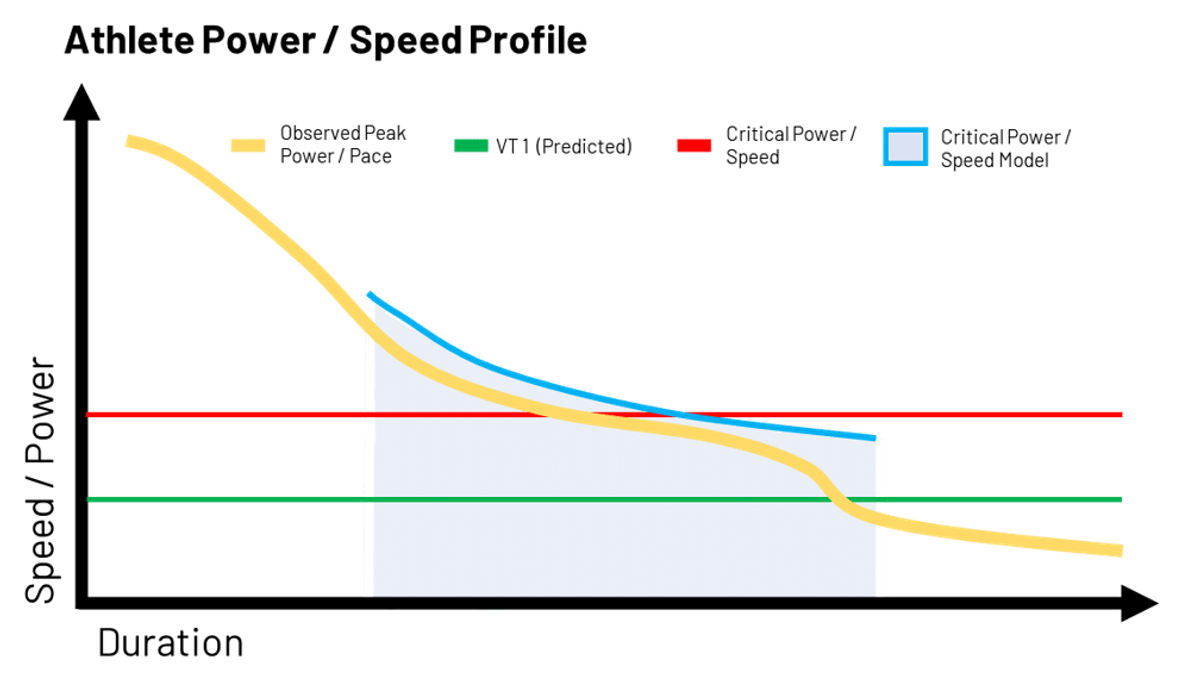
Figure 1. The new cycling power profile chart on Athletica, using Athletica ambassador Andi Boecherer’s training data. Key values include predicted aerobic threshold (VT1 predicted), critical power and observed peak power. See text for more details.
To begin with an example, let’s start with Andi Boecherer’s bike data over the last 6 weeks shown in Figure 1. At the time of writing, Andi is currently preparing for the Ironman South Africa event in 4 weeks time, and he’s completed some periods of training over the last 6 weeks at both his home in Germany and at a training camp in the Canary Islands (for more detail, watch the video series Andi Tells All on our
YouTube channel
). Figure 1 shows Andi’s maximal mean power output attained over exercise durations ranging from very short so-called anaerobic sprints, to very long aerobic efforts, and everything else in between. This is revealed as his ‘observed peak power’.

Figure 2. The new running speed profile chart on Athletica, using Athletica ambassador Andi Boecherer’s training data. Key values include predicted aerobic threshold (VT1 predicted), critical speed and observed peak speed. See text for more details.
Additionally, we have Andi’s run data obtained over this same 6 weeks shown in Figure 2. This is very similar to his bike power profile except the duration of run training is less and his running speed (pace) data is used instead of power. Fundamentally, you will note from both figures that the longer the duration he goes, the lower the intensity becomes. This data anchors the remaining key features that can be used to gain insight into his performance potential, to look at strengths and weaknesses, as well as to whether changes in training content are needed.
The key features of the charts include:
While we are only getting started, already we can see that our algorithm captures CP very reliably. For example, Andi’s estimated critical power and speeds were within 3% of those attained in his laboratory tests. The methods we implement within Athletica therefore are the most convenient way to create a power profile, as we retrospectively use your field-derived maximal mean power data from training and racing over pre-defined durations. While a laboratory test may still be the gold standard, for those of us that can’t afford the time and money, we feel this innovation is pretty helpful.Since there is not yet consensus as to the best methodology, we will continue to develop robust strategies in the future that will work across a number of possible use cases. Already however, our methodologies align well with the current understanding around:
We’re going to be highlighting how you and your coach can use this data in future blog posts and videos. Briefly however, you can probably appreciate how the data can be used to:
For direct insight into how we’re using this tool for Andi, be sure to tune into our YT series on Andi!
Burnley M, Jones AM. Power-duration relationship: Physiology, fatigue, and the limits of human performance. Eur J Sport Sci. 2018 Feb;18(1):1-12.
Hill DW. The critical power concept. A review. Sports Med 1993 Oct;16(4):237-54.
Leo, P., Spragg, J., Podlogar, T. et al. Power profiling and the power-duration relationship in cycling: a narrative review. Eur J Appl Physiol 122, 301–316 (2022).
Maffetone P, Laursen PB. Maximum Aerobic Function: Clinical Relevance, Physiological Underpinnings, and Practical Application. Front Physiol. 2020 Apr 2;11:296.
Poole DC, Burnley M, Vanhatalo A, Rossiter HB, Jones AM. Critical Power: An Important Fatigue Threshold in Exercise Physiology. Med Sci Sports Exerc. 2016 Nov;48(11):2320-2334.
Quod MJ, Martin DT, Martin JC, Laursen PB. The power profile predicts road cycling MMP. Int J Sports Med. 2010 Jun;31(6):397-401.
Whipp BJ, Huntsman DJ, Stoner N, Lamarra N, and Wasserman K. A constant which determines the duration of tolerance to high-intensity work. Fed Proc 41: 1591, 1982


