By: Andrea Zignoli, Stefano Andriolo, Harrison Dudley-Rode, Marjaana Rakai, Paul Laursen
In collaboration with: Andrea Giorgi and Borja Martinez Gonzalez, Team VF Bardiani Faizanè
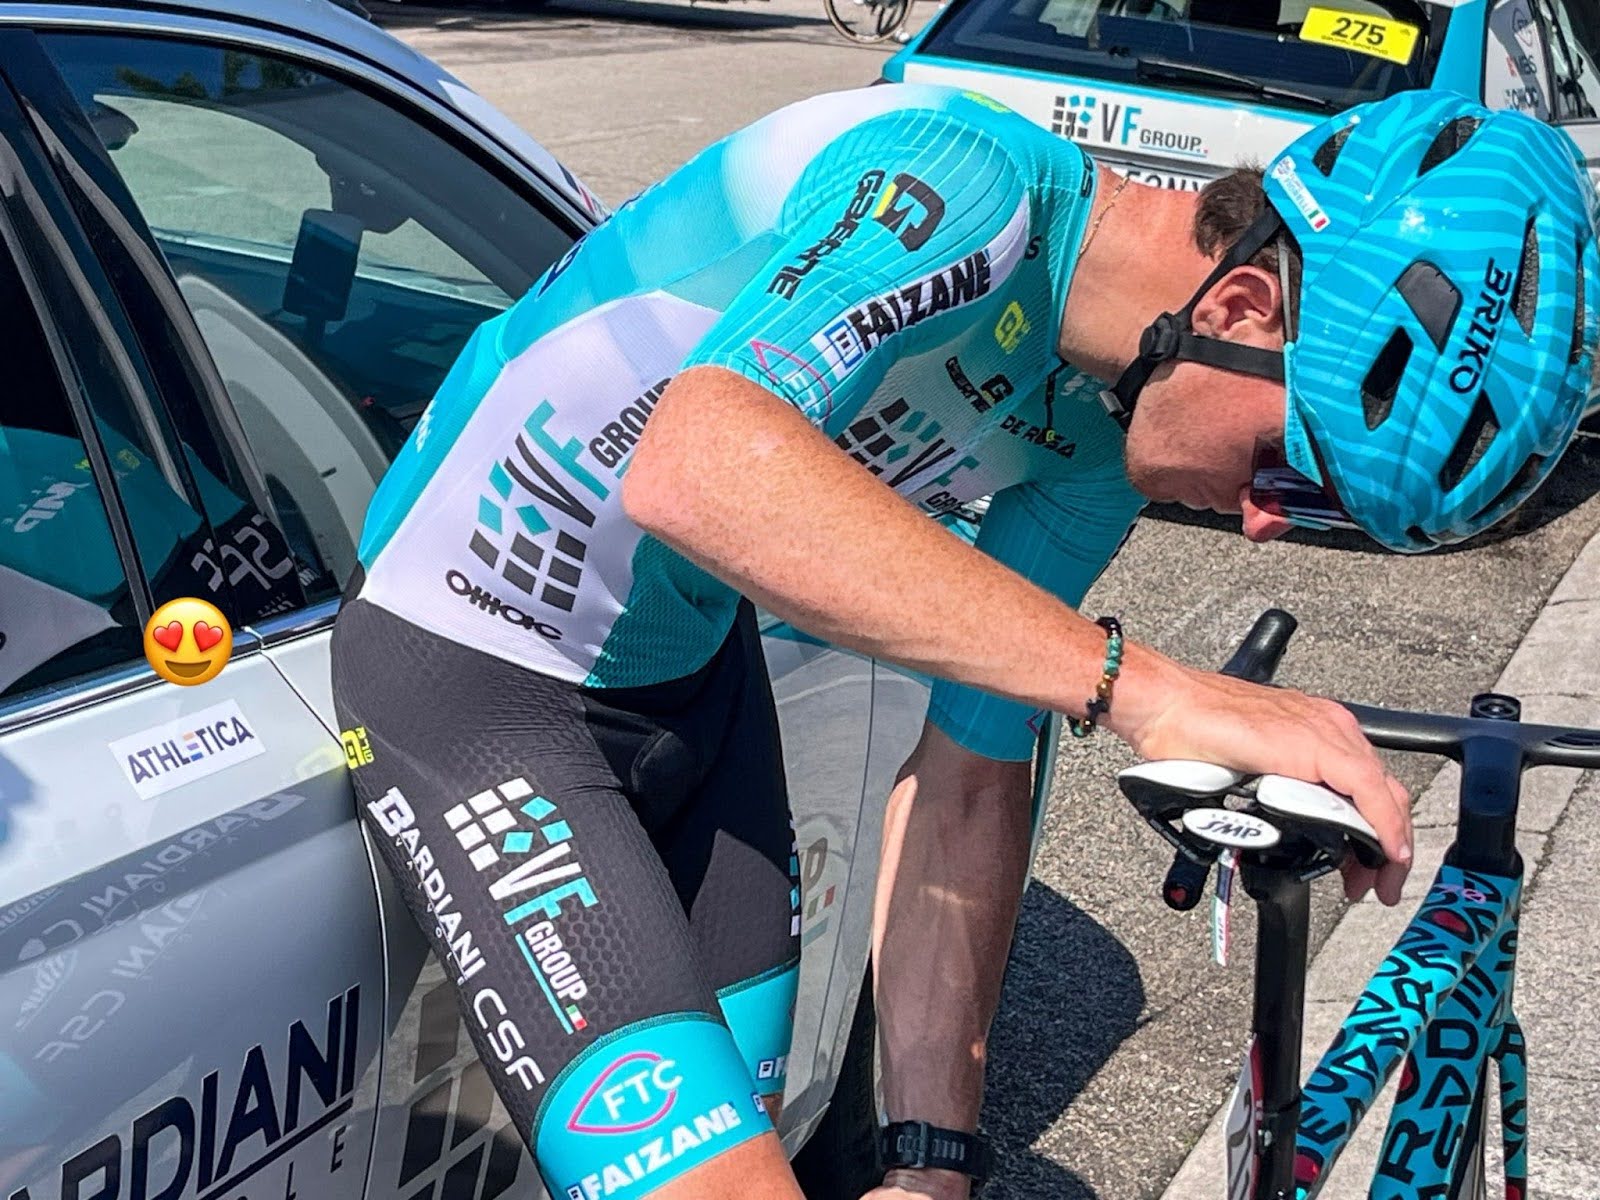
Giro d’Italia is one of the three main Grand Tours in the professional cycling world (the other two are the Tour de France and the Vuelta a Espana). Every cyclist dreams of participating in a Grand Tour at least once in their lifetime. Athletica has the immense privilege to be able to follow and support the Team VF Bardiani Faizanè for the whole 2025 season, which includes participation in the Giro d’Italia.
The Giro d’Italia 2025
The Giro winds 3,400 km around Italy in 21 stage starts. Sounds like a holiday ride with friends, until you realise every kilometre is timed, recovery is measured in hours, and there’s no pit-stop for gelato. Every team competes with eight riders.
So here’s the problem: riders must hit fresh-leg power numbers when they’re anything but fresh.
This is how the altimetry of the Giro d’Italia 2025 looked like:

The elevation profile of the 21 stages of the Giro d’Italia 2025.
As you can see, there are stages longer than others. Some stages are flat, whilst others have high vertical gain. To place yourself in the top position, you need to be able to perform well on different terrains: on uphill climbs, flat roads, time-trials, sprints, etc. You do not only need raw power, but a good power-to-weight ratio, and especially an ability to sustain these power values for prolonged durations. This concept can be summarised in the so-called ‘power profile’.
Power profile of professional cyclists
If we leverage Athletica’s power profiling techniques, we can retrieve the ‘power profile’ for the cyclists of the Team VF Bardiani Faizanè during the Giro d’Italia.

The power profile of the cyclists taking part in the Giro d’Italia 2025 of the Team VF Bardiani Faizanè. This is built by taking the maximum mean power values at 5 sec, 30 sec, 1 min, 5 min, 10 min, and 20 min. Data from Athletica. Of the eight riders starting the Giro, one had to retire at stage 6th and and one at stage 16th.
As you can see from the graph, these professional cyclists were able to deliver 15.9 W/kg for 10 seconds or 11.4 W/kg for 30 seconds (these values are mostly relevant for sprinters, since usually sprints last 10-20 seconds). These cyclists can deliver more than 6.9 W/kg for 5 minutes and 6.3 W/kg for 10 minutes (these values are more relevant for small climbs and time-trial efforts).
To put this in context, Valenzuela et al. (2022) reported that the top 10% of professional cyclists can keep 18.9 W/kg for 10 seconds, and 7 W/kg for 10 minutes! These are likely indicative of the kinds of power-house cyclists you need to perform at the highest levels in professional cycling. Valunzuela et al. (2022) again reported that the bottom 10% of professional cyclists can maintain 14.3 W/kg for 10 seconds, and 5.9 W/kg for 10 minutes. Impressive, to say the least! The values at the bottom 10% are indicative of the minimal requirements to take part in professional cycling races.
The emerging concept of durability
It is important to highlight that the aforementioned values were what cyclists could deliver in a ‘fresh’ state. However, during a Grand Tour stage, you are very rarely ‘fresh’, and you need to be able to deliver high power values in ‘fatigued’ conditions, when it matters the most. Enter the emerging concept of durability. Simply put, the level of fatigue you are experiencing can be directly related to the work you have been doing on the bike.
If we are able to measure the power output of a cyclist, we can also calculate the work produced, in joules, by multiplying the power (in watts) by the time (in seconds). For example, if you sustain 250 W for 1 hour (3600 seconds), you produce: 250 W × 3600 s = 900,000 J = 900 kJ of work. Therefore, durability is about understanding the magnitude of decline in an athlete’s ability to produce power after accumulating significant amounts of work.
Mateo-March et al. (2025) recently reported that professional cyclists can experience a 6% drop in their 10-minute power output after accumulating 60 kJ/kg of work during a race. For those less familiar with energy-based metrics, 60 kJ/kg corresponds to a 68 kg rider averaging 250 W for ~4.5 hours.
Therefore, by creating different ‘power profiles’ for different amounts of work produced, we can have a picture of how durable our cyclists are. In our case, we would expect the power production capabilities of our cyclists to drop to less than 5 W/Kg if they had to keep their maximum power for 10 minutes after doing 50 kJ/kg of work. This can be the difference between winning or losing a stage.

Decrease in the maximum mean power output values (10 sec, 30 sec, 1 min, 5 min, 10 min, and 20 min) for different amounts of work done. Data from Athletica.
It is important to understand that during a race, it is primarily the team’s strategy that dictates when a rider must exert maximum effort. As a result, the collected data does not necessarily reflect the isolated effects of accumulated workload. Nevertheless, a consistent pattern emerges from the data presented: once the workload exceeds 50 kJ/kg, the capacity to produce peak performance declines. This trend holds true for both short efforts (10 seconds to 1 minute) and longer efforts (5 to 20 minutes). These findings are expected and align with observations commonly reported during Grand Tours.
Takeaways
Not every cycling team is willing to share their data immediately after a Gran Tour. We are incredibly fortunate to have the opportunity to share these considerations with you. At the same time, coaches and athletes are revisiting the data, together with additional analysis support using Athletica; considering what went right and what went wrong. Where might weaknesses and strengths lie? As always, Athletica aims to inform athletes on potential strategies for improving their performance in the future.
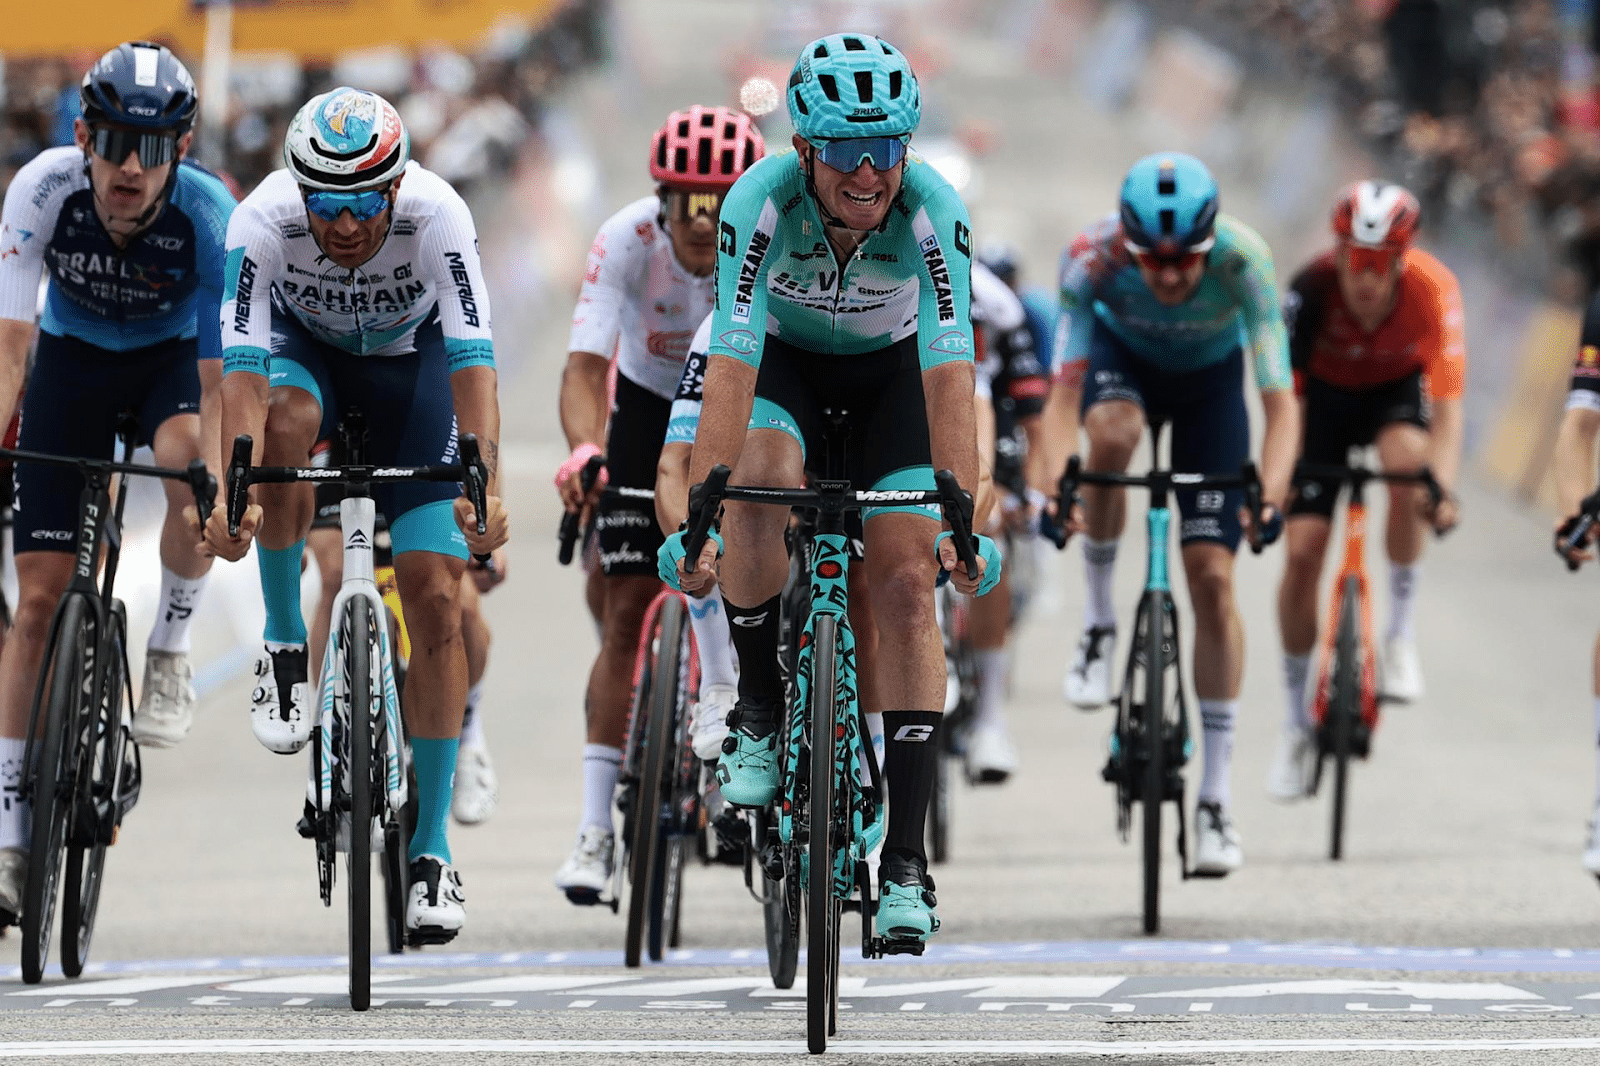
Filippo Fiorelli claimed 8th place in Stage 15th of the Giro d’Italia 2025. Photo credits: VF Group Bardiani – CSF Faizanè & Sprint Cycling.
Can the durability values be used for talent scouting or in the selection of the best cyclists for the Gran Tour participations? Can we gather insights on what constitutes the best performance prediction metric in the different stages? These are the questions that Athletica helps address for the Team VF Bardiani Faizanè with. Athletica helps Team VF Bardiani Faizanè by figuring out the answers to these questions.
With the Giro behind us, we now focus on the remaining races and training camps of the season, recognizing that our knowledge is ever-evolving. Coaching a professional team is truly a never ending process, as is data analysis and reporting. With the help of Athletica analytical techniques and models, athletes can enjoy the same kind of analysis that was once only reserved to professional teams.
We are aware of the fact that professional cycling teams cannot constitute the norm for every athlete. But they set a benchmark, and they give us reference values for comparison. With these values in mind, we can set expectations, or set goals, with an ever-moving horizon to keep us motivated.
❤️ Follow and support the Team VF Bardiani Faizanè for daily updates on the social channels:
Instagram: https://www.instagram.com/vfgroupbardianicsffaizane/
X: https://x.com/Bardiani_CSF
Facebook: https://www.facebook.com/greenprojectbardianicsffaizane
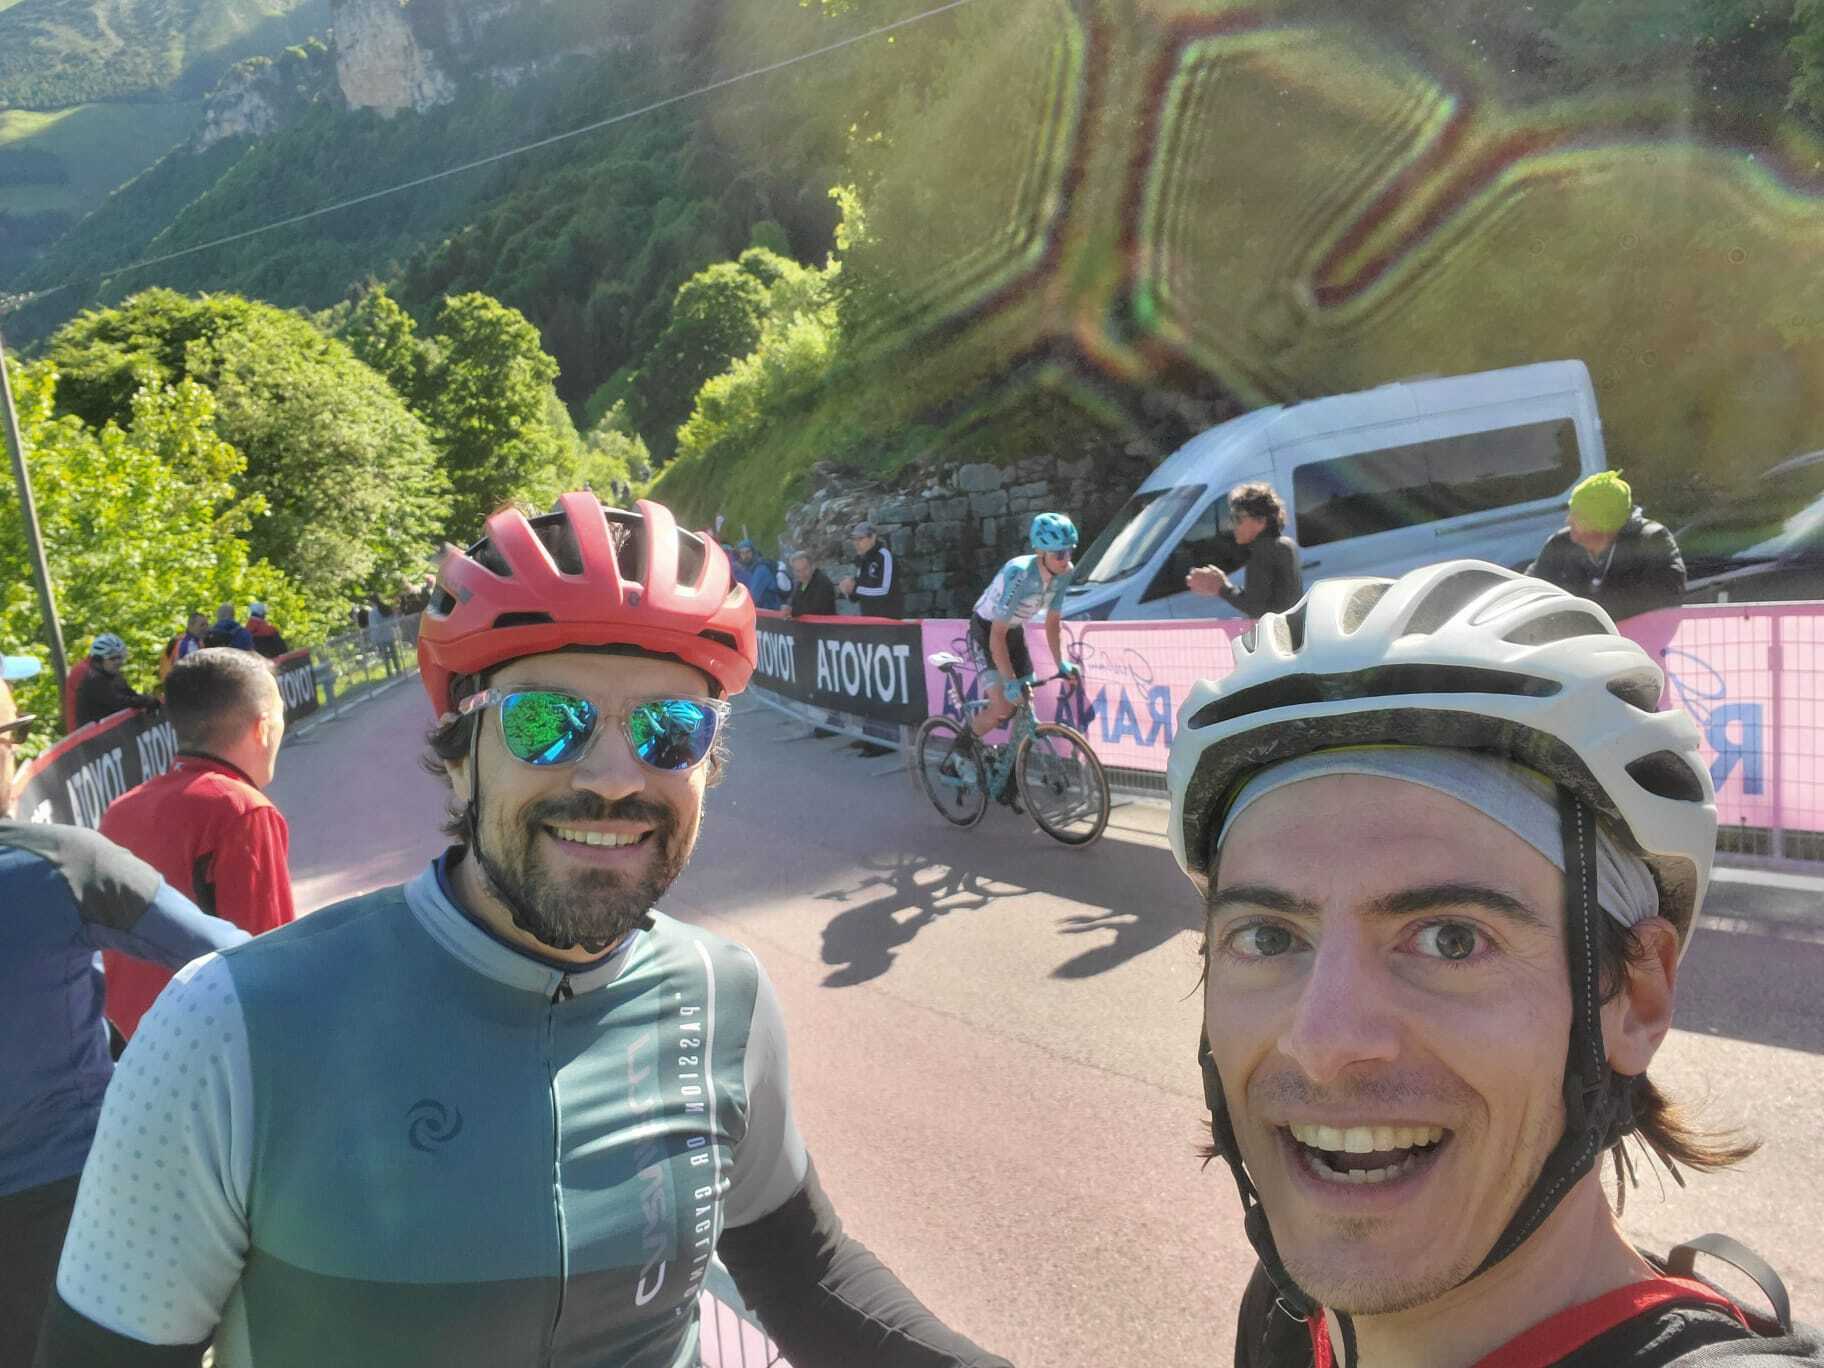
The Athletica Team cheering for Team VF Bardiani Faizanè at the Giro.
🗣️ Do you have a comment on Athletica ‘power profiles’? Post it on the Athletica Forum: https://forum.athletica.ai/t/new-release-upgraded-power-and-pace-profiles-with-descriptions-and-areas-for-improvement/1812
Additional readings 📖
- Athletica blog: Unlocking Endurance Durability: The Missing Link in Performance https://athletica.ai/unlocking-endurance-durability-the-missing-link-in-endurance-performance/
- Athletica blog: Athletica partnership with Team VF Bardiani Faizanè https://athletica.ai/athletica-ai-partners-with-vf-group-bardiani-csf-faizane-to-revolutionize-performance-analytics-in-cycling/
- Athletica blog: “Going beyond the threshold” – power profiling is the future of training load control https://athletica.ai/future-of-training-load-control-power-profiling/
Additional listening 👂
- Athlete’s Compass podcast: Why Your Endurance Training Workouts Need Athlete Profiling https://athletica.ai/the-athletes-compass-podcast/why-your-endurance-training-workouts-need-athlete-profiling/
Scientific papers 👩🏻🏫
- Mateo-March M, Moya-Ramón M, Sánchez-Jiménez JL, Peña-González I, Javaloyes A. Decoding Victory in Cycling’s Grand Monuments: A Performance Analysis of Top-5 Versus Top-6-30 Finishers. Scand J Med Sci Sports. 2025 May;35(5):e70057. doi: 10.1111/sms.70057. PMID: 40281393.
- Barranco-Gil, D., Mateo-March, M., Muriel, X., Pallarés, J.G., Lucia, A. and Valenzuela, P.L. (2025), What Does It Take to Reach the Podium? Power Output and Heart Rate-Derived Racing Demands of Top Cyclists During Grand Tours. Scand J Med Sci Sports, 35: e70074. https://doi.org/10.1111/sms.70074
- Muriel X, Mateo-March M, Valenzuela PL, Zabala M, Lucia A, Pallares JG, Barranco-Gil D. Durability and repeatability of professional cyclists during a Grand Tour. Eur J Sport Sci. 2022 Dec;22(12):1797-1804. doi: 10.1080/17461391.2021.1987528. Epub 2021 Oct 24. PMID: 34586952.
- Mateo-March M, Leo P, Muriel X, Javaloyes A, Mujika I, Barranco-Gil D, Pallarés JG, Lucia A, Valenzuela PL. Is all work the same? Performance after accumulated work of differing intensities in male professional cyclists. J Sci Med Sport. 2024 Jun;27(6):430-434. doi: 10.1016/j.jsams.2024.03.005. Epub 2024 Mar 26. PMID: 38604818.
- Valenzuela PL, Muriel X, van Erp T, Mateo-March M, Gandia-Soriano A, Zabala M, Lamberts RP, Lucia A, Barranco-Gil D, Pallarés JG. The Record Power Profile of Male Professional Cyclists: Normative Values Obtained From a Large Database. Int J Sports Physiol Perform. 2022 May 1;17(5):701-710. doi: 10.1123/ijspp.2021-0263. Epub 2022 Feb 21. PMID: 35193109.
- VAN Erp T, Sanders D, Lamberts RP. Maintaining Power Output with Accumulating Levels of Work Done Is a Key Determinant for Success in Professional Cycling. Med Sci Sports Exerc. 2021 Sep 1;53(9):1903-1910. doi: 10.1249/MSS.0000000000002656. PMID: 33731651.

