New year, new me – Athletica introduces new athlete profiling features
In our most recent blog, we discussed the scientific rationale behind power profiling in cycling. In case you haven’t read it yet, we strongly encourage you to go back to check it out so you don’t find yourself “zoning out” halfway through this piece.
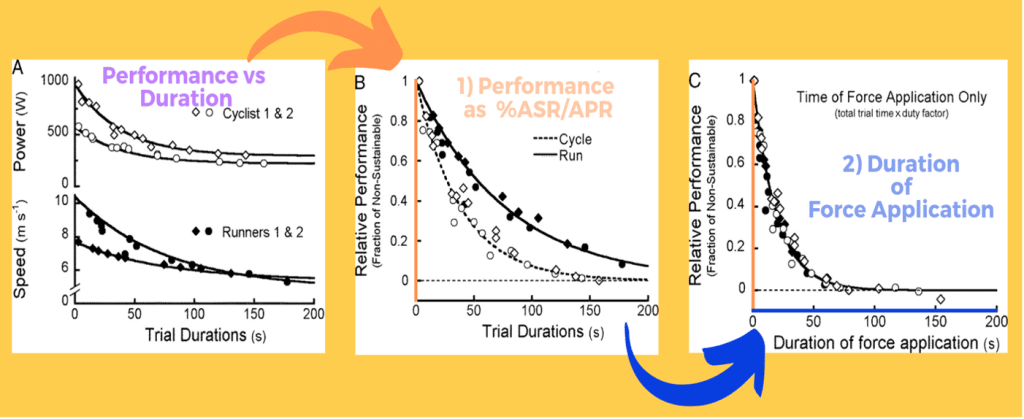
Similar to cycling, a performance duration (PD) curve can also be constructed for running by recording the maximal mean speed (MMS) for each duration across the time continuum (Figure 1). The true limits of exercise across any given duration are obtained by use of mathematical modelling. In addition to the critical power/speed model, which spans the heavy-intensity exercise range (2-60 min), Athletica now further incorporates two new models; anaerobic speed/power reserve (ASR/APR) and Omni power duration (OmPD), which allows its users to track their adaptations within the extreme-to-severe (0-5 min) and heavy-to-moderate (>5 min) domains, respectively.
You are most likely an extremely self-motivated endurance athlete if you are here. If you are an extremely self-motivated sprint athlete, do not fret. This article is also for you.

“What is important is to spread confusion, not eliminate it.” – Anaerobic Speed/Power Reserve is not limited by anaerobic metabolism
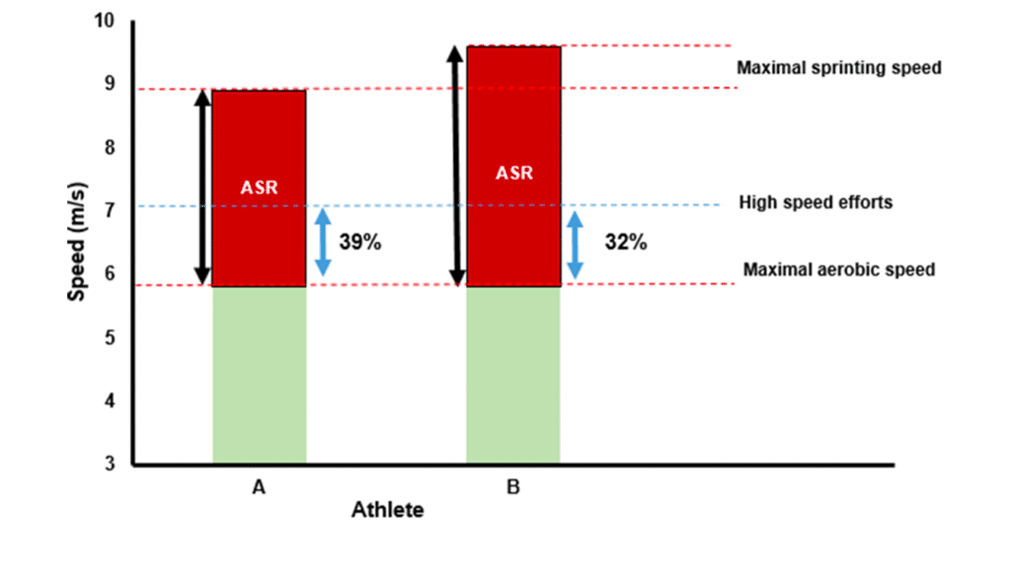
The anaerobic speed or power reserve (ASR/APR) is the intensity range between two key performance landmarks; the maximal sprinting speed or peak (1 s) cycling power (MSS/Pmax) and the velocity/power that elicits the maximal oxygen consumption (v/pV̇O2max); (Weyand et al., 2006; Bundle et al., 2006; Bundle & Weyand, 2012). However, as the quantification of expired gases is not freely accessible, the bottom border of the ASR/APR tends to be marked by a more practical parameter. That is, the speed/power attained at the end of an incremental exercise test (maximal aerobic speed/power; MAS/MAP; Figure 2).
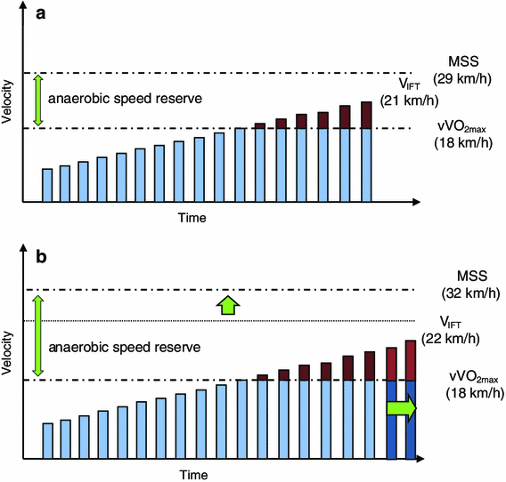
An incremental exercise test was always designed with the thought of eliciting the V̇O2max toward the end of the protocol. Therefore, MAS/MAP can be an accurate indication of maximal aerobic abilities if one reaches exhaustion exactly as their oxygen consumption reaches its physiological limit. But how could you possibly know if you actually reached your true ceiling? What if you in fact had another gear left in your engine? MAS/MAP measurement is highly dependent upon the duration of the stages, the magnitude of intensity increments and whether or not there are recovery periods in between them (Riboli et al., 2021). Thus, if you decided to engage in the honourable practice of self-experimentation and performed an incremental test on a treadmill or your bike trainer to estimate your MAS or MAP, the protocol chosen will significantly impact the final speed or power reached, and hence your ASR or APR estimate, respectively (Figure 2).
A famous 20th-century surrealist, Salvador Dali once said: “What is important is to spread confusion, not eliminate it”. No professional community is more guilty of instilling confusion in the general public than the scientists themselves. I came across two simple examples from the world of fauna and two from flora that amuse me immensely. On a side note, this is another common feature of Homo scientificus (not a real scientific name!). We adore intentional ambiguity. So to start with the animal example, starfish or jellyfish are not fish at all! These invertebrates (meaning they have no spine) are echinoderms and cnidarians, respectively. Analogously, peanuts and walnuts are not actually nuts. They are seeds of a legume (Arachis hypogaea) and a drupe (Juglans regia), respectively. A drupe? “I have never eaten a such thing in my life”, you might say. Actually, many of us are low-key “drupe addicts”. We tend to call them “coffee drinkers”. Now, you would not call coffee a nut, would you?
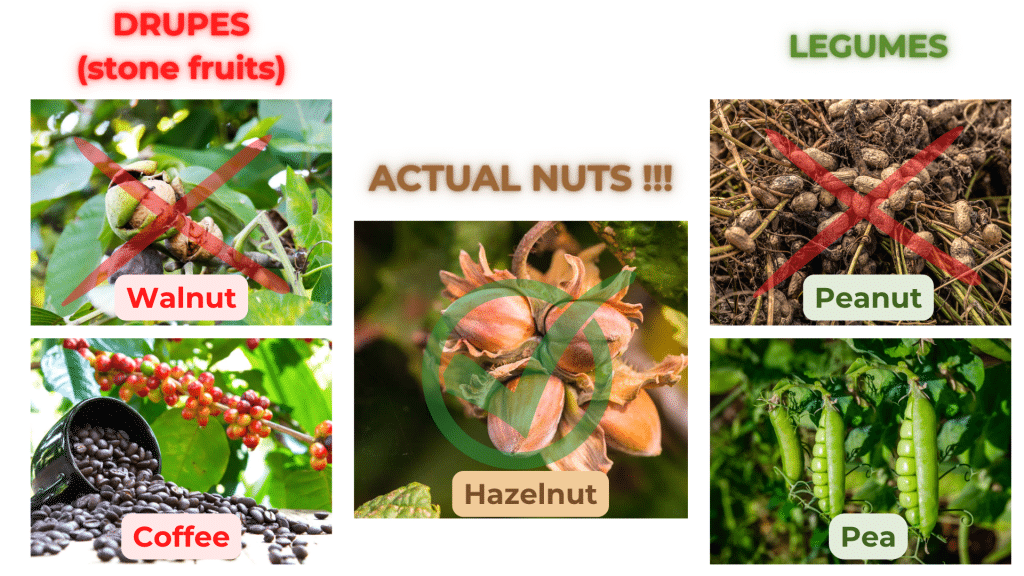
Back from the zoology/botany class, this is exactly what the sports scientists did when they named the ASR/APR. Omitting the fact, that it is effectively impossible to reliably and accurately quantify the energetic contribution of the anaerobic metabolism to all-out exercise (Rusko et al., 1993; Nummela, 1996; Noordhof et al., 2010; Buchheit & Laursen, 2013). Professors Matt Bundle and Peter Weyand gave the name “Anaerobic” to an exercise range that is not limited by the kinetics of the anaerobic energy pathways (phosphocreatine system and glycolysis). I can guarantee you they were absolutely aware of the conclusion of their work: “Top-end exercise is not limited by the abilities of anaerobic metabolism”. However, they decided to simplify the term for “non-science” folk by introducing confusion as they named Juglans regia (i.e. ASR) a “wal -NUT” (i.e. Anaerobic Speed Reserve) instead of naming the finding for what it exactly is… a “wal -DRUPE” (i.e. Mechanically Unsustainable Speed Reserve).
If my explanations are not satisfactory and you still feel like roaming within the mist of ambiguity, you can learn everything ASR/APR from the sprint guru, Professor Peter Weyand himself, in our “Science and Application of ASR/APR” course or listen to the highlights of his research on a recent Training Science Podcast episode.
The dose makes the poison – the mystery of relentless “anaerobic fatigue”
The apparent “mistake” of naming the top speed/power reserve “anaerobic” is not as blasphemous as you might think at this stage. When exercising above the V̇O2max-related intensity, although extremely non-sustainable, elevated levels of mechanical work can be achieved. Now if you go back in memory to your physics class, you might be able to recall the Law of Conservation of Energy which states that: “energy cannot be created nor destroyed, but it is converted from one form to another”. Therefore, the non-sustainable levels of work (or else the kinetic energy due to the body’s movement) above V̇O2max must be supplied by the chemical energy from metabolic pathways that do not use oxygen for the combustion of nutrients. That is, they are ANAEROBIC!
Now, I hope you have a greater appreciation for the forefathers of ASR/APR as the intensity domain they discovered is entirely sufficed by the anaerobic metabolism. However, the “taxological” issue arose with the research on Critical Speed/Power (CS/CP). Namely, the finding of the inability to achieve a sustainable and steady aerobic metabolism beyond the CS/CP intensity, suggests that anaerobic energetic contribution begins to increase substantially even before the attainment of MAS/MAP (Morton, 2006; Poole et al., 2016). Moreso, the degree to which the anaerobic energy contributes to the mechanical output below MAS/MAP is strongly dependent on the pattern of muscle recruitment. Increased activation of large and fatigable fast-twitch muscle fibres results in increased energy production through anaerobic glycolysis (releasing energy from glucose without the use of oxygen) as suggested by increases in blood lactate appearance, ventilation and consequently a larger V̇O2 for a given intensity below MAS/MAP (Burnley et al., 2012; Grassi et al., 2015). This evidence is highlighting again that MAS/MAP does not represent a consistent physiological landmark. Although MAS/MAP is not a reliable landmark of V̇O2max-related work rate, it is currently the best tool we have for targeting/instigating the maximal aerobic response in training.
Or is it?
One, somewhat overlooked study in the early 2000s showed that runners’ ability to prolong their efforts during repeated runs at 90-140% MAS was better explained by their ASR amplitude than by how high their MAS was (Blondel et al., 2001). Analogously, team sport players with larger ASR amplitudes were observed to experience lower metabolic demand (lower blood lactate) and neuromuscular fatigue in response to a generic HIIT session (Buchheit et al., 2012). As of today, we cannot precisely tell what mechanisms are responsible for fatigue within the ASR/APR intensity range. But with an increasing degree of certainty, we can conclude that how deep (in relative terms) athletes tap into “the mysterious ASR fatigue” is what determines the severity of the HIIT session.
To illustrate, consider two elite runners A and B, who present the same MAS of 6 m/s (21.6 km/h). However, athlete A has an MSS of 9 m/s (32.4 km/h), while his faster (better-looking) friend peaks at 10 m/s (36 km/h). Therefore, if they both do 400m repeats at 117% MAS or 7 m/s (25.2 km/h), Athlete A will be running at 39% of his ASR, while the faster athlete B is only at 32% (Figure 3). Following our understanding of ASR, runner A will be “digging his grave” on the athletic club’s track if he wants to keep up with handsome fellow B. Therefore, the development of aerobic capacity may potentially be not only optimised for the intensity as we do by prescribing intervals as a %MAS or %MAP, but also for the severity of the stimulus by respecting the athletes’ ASR amplitude.
Unfortunately, we simply do not know enough about ASR/APR yet to entertain such an approach. One could argue that we could standardise loading as %APR by simply targeting the amount of “ anaerobic energy deficit” created by working for a given duration above MAP. However, I beg you to appreciate the fact that fatigue experienced in the ASR/APR range IS NOT METABOLIC! Remarkably though, the rates of decline in running speed and cycling power are the exact same when first, performance (vertical axis) is expressed as a %ASR/APR and second, when only duration (horizontal axis) of force application is considered (Figure 4). This tells us two things. One, an extremely simple solution can help us reveal the most bizarre science. Two, the rate of fatigue development in the ASR/APR domain is not influenced by the modality of exercise but by the magnitude of activation of the larger and stronger fast-twitch muscle fibres and subsequently the reliance on anaerobic metabolism (Bundle & Weyand, 2012).
If you are still here with me (and congratulations if you are!), it is not the anaerobically-derived energy per se that causes muscle fatigue at the intensities above MAS/MAP, but some intrinsic muscle mechanism that runs parallel to the activation of anaerobic metabolism. What is the most exciting takeaway from this is that the mystical “anaerobic/glycolytic fatigue” does not only apply to HIIT but potentially to any intensity as (surprise, surprise…) the anaerobic/glycolytic and aerobic/mitochondrial energy pathways are not soloists but two members of a state-of-the-art metabolic orchestra.
In the 2nd part of this article, I will explain to you the inner workings of this “metabolic symphony”. Next, you will learn how profiling the all-out performance using the ASR/APR model can tell us what locomotor profile (muscular phenotype) an athlete is, and how this governs the way they generate energy in contracting muscles. Finally, I will bring you cutting-edge science and real-life examples of how the metabolic phenotype impacts the response to HIIT, the overall training load and race performances.
About me
My name is Filip Kolodziej and I hold degrees in BSc Physiology and MSc Exercise Physiology. I was born in Poland where I developed a great passion for all the sports I could get my hands on. From swimming, through soccer, to ski jumping. Although, I’m not sure if jumping off a couch while watching the broadcast on Eurosport as a 9-year-old counts as legit ski jumping.
I went to high school in Youghal, county Cork (the venue of Ironman Ireland), where I discovered the sport of triathlon. When I was 16, I got inspired to study exercise science by a local triathlete, “prize-hunter”, and exercise physiologist who was crushing the entire field well into his 40s!
My biggest sporting achievement must be swimming 10×400 butterfly off a 30-second rest (common Eastern European training methods back in the day) as a 15-year-old. While my two proudest moments in science are publishing both my BSc and MSc theses in peer-reviewed journals. My dreams are to do a PhD in the exercise physiology field and to beat that old physiologist in a head-to-head race. I am coming after you, Trevor!
References
Andersson, N., Häkkinen, K. and Rusko, H. (1996) “Effect of inclination on the results of the maximal anaerobic running test,” International Journal of Sports Medicine, 17(2), pp. S103–S108. Available at: https://doi.org/10.1055/s-2007-972909.
Blondel, N. et al. (2001) “Relationship between run times to exhaustion at 90, 100, 120, and 140 % of vV˙O2max and velocity expressed relatively to critical velocity and maximal velocity,” International Journal of Sports Medicine, 22(1), pp. 27–33. Available at: https://doi.org/10.1055/s-2001-11357.
Buchheit, M. (2010) “The 30-15 Intermittent Fitness Test: 10 year review.,” Martin Buchheit. Myorobie Journal, January. Available at: http://3015ift.files.wordpress.com/2013/07/buchheit-30-15ift-10-yrs-review-2000-2010.pdf. (Accessed: January 2023).
Buchheit, M. and Laursen, P.B. (2013) “High-intensity interval training, solutions to the programming puzzle,” Sports Medicine, 43(10), pp. 927–954. Available at: https://doi.org/10.1007/s40279-013-0066-5.
Buchheit, M., Hader, K. and Mendez-Villanueva, A. (2012) “Tolerance to high-intensity intermittent running exercise: Do oxygen uptake kinetics really matter?,” Frontiers in Physiology, 3(406), pp. 1–13. Available at: https://doi.org/10.3389/fphys.2012.00406.
Bundle, M.W. and Weyand, P.G. (2012) “Sprint Exercise Performance,” Exercise and Sport Sciences Reviews, 40(3), pp. 174–182. Available at: https://doi.org/10.1097/jes.0b013e318258e1c1.
Bundle, M.W. et al. (2006) “A metabolic basis for impaired muscle force production and neuromuscular compensation during Sprint Cycling,” American Journal of Physiology-Regulatory, Integrative and Comparative Physiology, 291(5), pp. 1457–1464. Available at: https://doi.org/10.1152/ajpregu.00108.2006.
Burnley, M., Vanhatalo, A. and Jones, A.M. (2012) “Distinct profiles of neuromuscular fatigue during muscle contractions below and above the critical torque in humans,” Journal of Applied Physiology, 113(2), pp. 215–223. Available at: https://doi.org/10.1152/japplphysiol.00022.2012.
Grassi, B. et al. (2010) “Slow VO2 kinetics during moderate-intensity exercise as markers of lower metabolic stability and lower exercise tolerance.,” European Journal of Applied Physiology, 111(3), pp. 345–355. Available at: https://doi.org/10.1007/s00421-010-1609-1.
Morton, R.H. (2005) “The critical power and related whole-body bioenergetic models,” European Journal of Applied Physiology, 96(4), pp. 339–354. Available at: https://doi.org/10.1007/s00421-005-0088-2.
Noordhof, D.A., de Koning, J.J. and Foster, C. (2010) “The maximal accumulated oxygen deficit method,” Sports Medicine, 40(4), pp. 285–302. Available at: https://doi.org/10.2165/11530390-000000000-00000.
Poole, D.C. et al. (2016) “Critical power,” Medicine & Science in Sports & Exercise, 48(11), pp. 2320–2334. Available at: https://doi.org/10.1249/mss.0000000000000939.
Riboli, A. et al. (2021) “Testing protocol affects the velocity at vo2max in semi-professional soccer players,” Research in Sports Medicine, 30(2), pp. 182–192. Available at: https://doi.org/10.1080/15438627.2021.1878460.
Rusko, H., Nummela, A. and Mero, A. (1993) “A new method for the evaluation of anaerobic running power in athletes,” European Journal of Applied Physiology and Occupational Physiology, 66(2), pp. 97–101. Available at: https://doi.org/10.1007/bf01427048.
Sandford, G.N., Laursen, P.B. and Buchheit, M. (2021) “Anaerobic Speed/Power Reserve and sport performance: Scientific basis, current applications and future directions,” Sports Medicine, 51(10), pp. 2017–2028. Available at: https://doi.org/10.1007/s40279-021-01523-9.
Weyand, P.G., Lin, J.E. and Bundle, M.W. (2006) “Sprint performance-duration relationships are set by the fractional duration of external force application,” American Journal of Physiology-Regulatory, Integrative and Comparative Physiology, 290(3), pp. R758–R765. Available at: https://doi.org/10.1152/ajpregu.00562.2005.


