“Time is money” – the countless issues with an indefinite threshold-based intensity control
In the endurance sports community, we often hear about the laboratory-measured parameters such as the V̇O2max, max aerobic power (MAP), fractional oxygen utilisation, first and second lactate (LT1 and LT2) or ventilatory (VT1 and VT2) thresholds, maximum lactate steady state (MLSS) and gross efficiency (%power/energy expenditure). Although numerous studies have revealed utility (some more than others depending on the character of the event) and shown correlations with endurance performance (Joyner and Coyle 2008), they fail to specifically describe an athlete’s abilities across the entire intensity-duration-continuum, often leaving us second guessing when it comes to planning individual workouts or race pacing strategy.
With the emergence of cycling power meters in the early 2000s, we were charmed by the allure of quantifying metabolic performance in the field. And then along came the “messiah” of intensity control for endurance cycling, the Functional Threshold Power (FTP). FTP is defined as the largest mean power that can be held for an hour and is assumed to approximate the maximal lactate steady state (MLSS; Bassett et al. 1999; Coggan 2003). However, several recent studies have shown that FTP varies significantly from MLSS (Borszcz et al. 2018; Valenzuela et al. 2018; Morgan et al. 2019; Karsten et al. 2020), thus questioning its utility for prescribing endurance training intensities (and duration). Nonetheless, most of the well-recognised training platforms offering individualised cycling training plans still prescribe the workout intensity relative to the FTP (i.e., %FTP). To add more fuel to the fire, the training stress is also calculated as a function of the work done relative to the FTP. While this is a good attempt at calculating load, most of us appreciate that it is a very crude estimation, and the number can be ‘baked’. Put simply, the load estimate is the equivalent of quantifying your earnings in a number of 100 US dollar notes rather than the exact number such as $35,532.50. That is, the estimate measures the exercise dose using a nominal rather than continuous scale; remember FTP is just a single number bound to a one-time point), instead of what you actually make after including the tax (the body’s response to exercise dose). In fact, to do science justice, this is more like a number of 100 Monopoly dollars as FTP has no physiological relevance. Sticking with our analogy — it looks like money (a scientifically-backed parameter) but in fact, it’s just a toy that we were given to make us feel like we earn enough money to build properties in Vienna (i.e. train based on scientific rationale).
There is no shame if you are currently using FTP to guide your cycling training. In fact, we’re still using a form of this method on Athletica for now. In fact, one of the most successful triathlon coaches in the past two years, Olav Aleksander Bu reminisces on the Training Science Podcast how Norwegian triathletes, including the Olympic champion from Tokyo, Kristian Blummenfelt, were primarily using FTP as a benchmark for setting their training zones back in 2015 when Olav joined the coaching team. Olav says: “the biggest gain came from athlete profiling and intensity control”. He reveals that what Kristian believed to be his anaerobic threshold (LT2/VT2) was inflated by around 20 Watts compared to his lactate-built profile! Learning from that story, one could conclude: “Perfect! I will just do an exercise test with an exercise physiologist and get my lactate profile and zones dialled in.” However, as we outlined above, LT2 is only an intensity-related parameter. It does not tell us how soon the fatigue/performance decrement will occur if we keep exercising at this intensity. Olav tells us that through a 9-month period leading up to the Olympic Games in Rio de Janeiro, he measured lactate across a vast range of intensities and durations to gain more insight into metabolic performance as a function of time. Yet, there are two main issues with this approach. First, blood lactate is only a proxy measure, which does not reflect the metabolic state of working muscles (Nixon et al. 2021), and power at MLSS fails to predict time-trial performance (Niemeyer et al. 2022). Second, we are talking about quite a bill once we’re done processing hundreds of lactate strips. So is there a better way?
The steady rise of power profiling — where we were and where we are now
The shortcomings of graded exercise test-derived parameters or ill-famed FTP are circumvented by power profiling; a practice of plotting the best-observed power output (a.k.a. maximal mean power; MMP) against time. MMP data, however, has several fundamental issues. First, unless you perform a formal test for every single duration, it is highly unlikely that any MMP for a given time point is actually a true maximal effort. For example, an MMP for 6 min could be the summation of a 5 min max effort in a race alongside a submaximal effort in the preceding or subsequent minute. Conversely, your 4 min MMP is most likely made up of an 80% part of that maximal 5 min best. Therefore, MMP data still doesn’t provide us with a clear-cut picture of your physiological limitations across the intensity-duration continuum.
Fortunately, the limitations of crude MMP profiling can be compensated with mathematical modelling. When power is plotted against time to-task failure (TTF), a hyperbolic power-duration (PD) relationship is observed and its extrapolation by means of mathematical modelling is currently considered the most faithful representation of physiological limits of exercise (Jones et al., 2010; Poole et al., 2016; Burnley and Jones, 2018). The PD profile comprises four distinct exercise intensity domains; moderate, heavy, severe, and extreme (Figure 1). Note that the transitions between the domains are smooth inflections rather than strict turn points, disputing the validity of ‘hard’ thresholds.

Critical Power
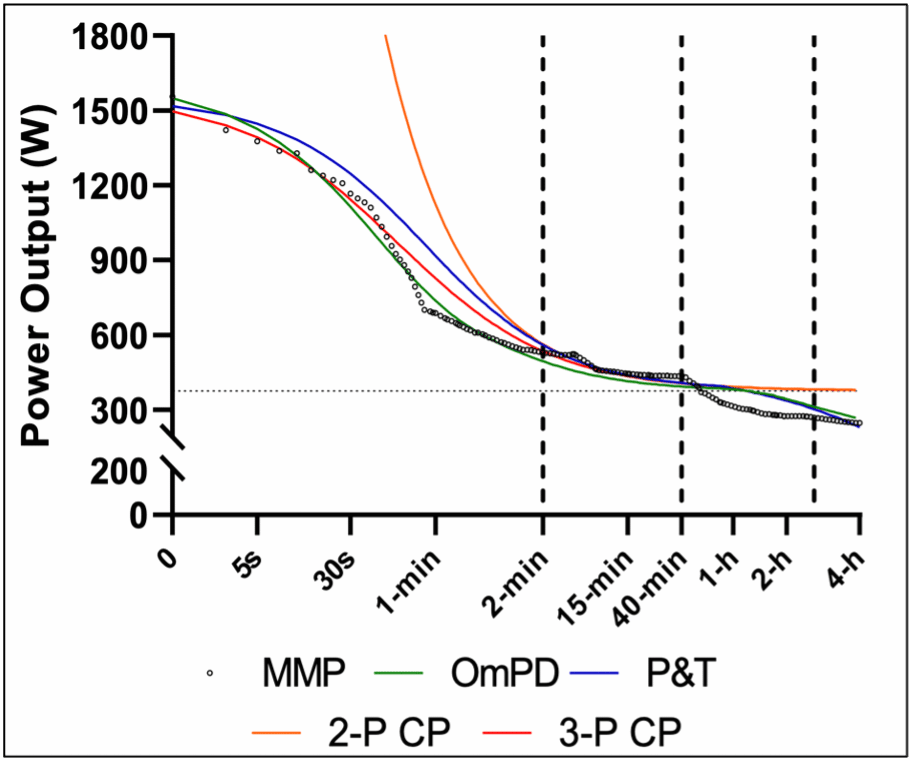
The boundary between the heavy and severe domains is marked by Critical Power (CP), beyond which a metabolic steady-state cannot be attained (Jones et al., 2019). The early two-parameter CP (2-P CP) model was derived from the hyperbolic PD relationship within the severe domain (Moritani et al. 1981; Whipp et al. 1982). However, its predictive utility was limited as the line representing the equation would travel infinitely up and right (Figure 2; orange line). This function implies that humans have an infinite maximal sprinting power (Pmax) and do not fatigue past 40 minutes of work! If that were the case we would never get the chance to experience Usain Bolt’s or Eliud Kipchoge’s greatness as most professional runners in the world would simply have the same exercise capacity from 2 min down and 40 min onwards. Inclusion of a third parameter, Pmax, aimed to solve the “Anyone with a pair of legs can win a 100 m dash in the Olympics” issue (Morton, 1996). However, the 3-P CP model was still markedly over-predicting the performance abilities within the extreme (sprinting) domain and did not address the “Anyone on an intravenous glucose drip can cycle hard until their indoor trainer falls apart” issue on the low-heavy and moderate domain side (Figure 2; red line).
Anaerobic Speed/Power Reserve
Clearly, predicting sprinting abilities required a different approach. Strikingly, our recent guest on the Training Science Podcast, Professor Peter Weyand, tells us that when we express power/speed outputs for short durations (<3 min) in terms of the reserve between Pmax and V̇O2max (anaerobic power reserve; APR), we can find anyone’s performance decay across the exact same hyperbolic trajectory — regardless of whether one is an elite sprinter or a TV reporter (Bundle et al. 2003; Weyand et al. 2006; Bundle and Weyand 2012). Incredibly, the APR model perfected the accuracy of prediction in the severe domain and also taught us that up to 3-minute efforts are not limited by the anaerobic metabolism, and thus debunks embedded terms in the exercise science vernacular such as anaerobic capacity or anaerobic fitness. Dr Weyand describes the phenomenon of the ASR/APR even more in-depth in our newest HIIT Science course. The utility of the APR model was recently extended to effectively estimate MAP from the 3 min MMP (Sanders et al. 2017; Sanders and Heijboer 2019b). That means you don’t need to do a GXT in a lab to know your V̇O2max-corresponding intensity! Moreover, Dajo Sanders and Mathieu Heijboer further improved the fit of the APR model (Sanders and Heijboer 2019b). Dajo also visited us on our podcast and explains how he applies the APR model in his training and coaching of World Tour cyclists in the second module of our APR course.
The limitation of the 3-P CP model to effectively predict power outputs in the heavy and moderate domain was addressed by Peronnet and Thibault (1989) when they proposed the exponential aerobic decay term (A). However, the practical utility of the P&T model (Figure 2; blue line) is limited due to the fact it requires MAP as an input parameter and predicts power output effectively only for durations longer than TTF at MAP. This means that unless you perform a formal test to exhaustion while working at a pre-determined V̇O2max intensity, the model doesn’t really know where to place the fatigue exponent A. Additionally, the P&T model requires the input of one’s basal metabolic rate (BMR). Unless quantified with costly direct calorimetry or closed-circuit spirometry in a physiology lab, you’re estimating BMR with prediction equations, which are grossly unreliable and inaccurate in athletic populations (Balci et al. 2021).
Omni Power Duration
The most recent OmPD model appears far more superior as it effectively predicts the power outputs for heavy and moderate durations (longer than TTF at CP) by using Pmax, W’ (mechanical power above CP; Figure 1) and CP (Puchowicz et al. 2020). This greatly increases the model’s practicality as you simply need to do three all-out efforts from the comfort of your own saddle. These will include a maximal burst to capture your 1-sec MMP (Pmax), and two time-trials, one at the top (2-5 min) and one towards the bottom (10-15 min) of the severe domain to predict your CP and W’ accurately (Karsten et al. 2015; Maturana et al. 2018; Muniz-Pumares et al. 2019).
“Talent wins games, but teamwork and intelligence win championships” – Athletica goes beyond
The legendary 6-time NBA Champion and 5-time NBA Most Valuable Player, Michael Jordan, has been deemed by many as the greatest to ever play the game of basketball. However, in many interviews or throughout the extremely popular documentary series “The Last Dance”, Jordan acknowledges that he would never win all the championships without the methodical integration of his talents with the abilities of his teammates in a well-functioning system. This is what we strive to do at Athletica. To win the championship (your priority race) instead of the individual games (“hero workouts”), we ingrate everything that each PD-predicting model has to offer to maximise the efficiency of our individualised training system. At the start of the year, we introduced into our platform the Performance-Duration curves and 3P-CP model for cycling (power) and running (speed) modalities.

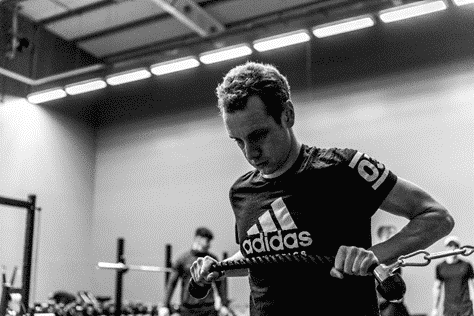
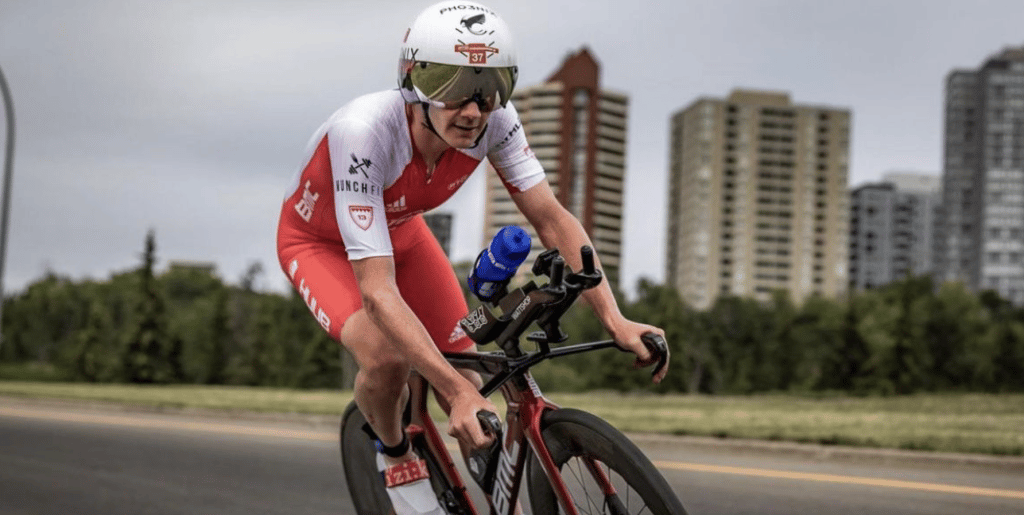
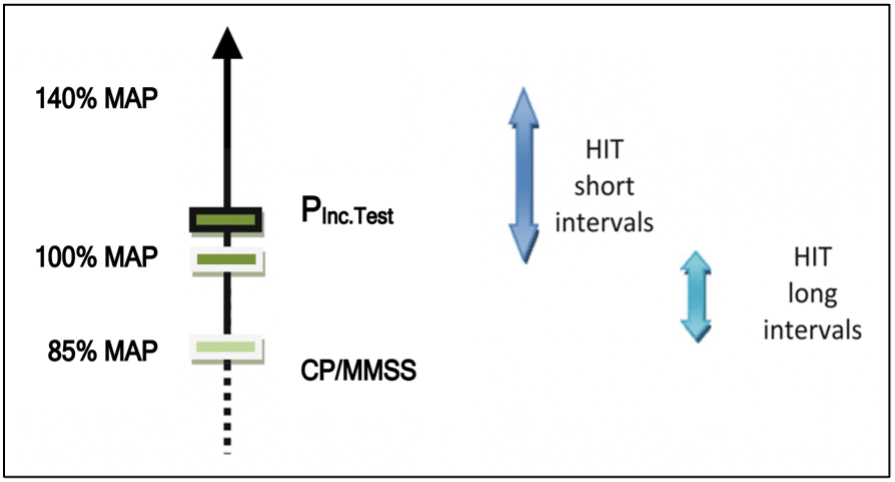
We are closing the year of 2022 with another bang! We are now adding the newest APR and OmPD models to the Performance-Duration curve. In the figure above, you can see the new-look PD curve for cycling based on the two-time Olympic champion, Alistair Brownlee’s MMP data from his last 6 weeks of training that included Athletica’s field testing protocols (Figure 3). You can pick and choose the model that you want to study. You can still see your cycling or running VT2 and VT1 from the user settings. While the new features carry a lot of promise we will still be using the arbitrary thresholds to control the intensity of some sessions. Especially the “Aerobic Development” sessions designed to improve your metabolic efficiency and health are still guided by the predicted VT1 to ensure that you are staying in the moderate/Zone 2 intensity which minimises the stress of exercise on the nervous system (Maffetone and Laursen 2020). Nonetheless, the new APR model now allows you to track your MAP (the bottom of APR) on a routine basis without the need to spend upwards of $200 for a V̇O2max laboratory test. What we are particularly excited about is that now you are empowered to pace your V̇O2max HIIT intervals more accurately than based on FTP (Figure 4).
In the not-so-distant future, we are planning to use the newly added APR and OmPD models to help us learn about the user’s physiology and optimise the individualisation of prescribed workouts, training volume, progression, and intensity distribution even more. How? You may ask… You will learn about the physiological relevance and application of APR and OmPD in the subsequent blog.
FAQs
How does power profiling compare to traditional methods like FTP in terms of accuracy and practicality for training and racing? Power profiling offers a more accurate representation of an athlete’s physiological limits across different intensity and duration ranges compared to FTP, which is a single-point estimate and may not accurately reflect an athlete’s performance capabilities, especially over different durations.
What are the practical steps an athlete or coach can take to implement power profiling in their training regimen? Athletes and coaches can start by collecting maximal mean power (MMP) data across a range of durations, then use mathematical modeling to establish the power-duration relationship. This information can be used to tailor training and racing strategies to an athlete’s specific physiological profile.
How does the introduction of models like the Anaerobic Speed/Power Reserve (ASR/APR) and Omni Power Duration (OmPD) impact the future of endurance training and performance optimization? The ASR/APR and OmPD models provide a more nuanced understanding of an athlete’s capabilities, particularly in the anaerobic and sprinting domains. By incorporating these models into training, athletes can optimize their performance across a broader range of intensities and durations, leading to more effective training and improved race outcomes.
References
Balci, A. et al. (2021) “Current predictive resting metabolic rate equations are not sufficient to determine proper resting energy expenditure in Olympic Young Adult National Team Athletes,” Frontiers in Physiology, 12, pp. Article 625370. Available at: https://doi.org/10.3389/fphys.2021.625370.
Bassett, D.R. et al. (1999) “Comparing cycling world hour records, 1967???1996: Modeling with empirical data,” Medicine & Science in Sports & Exercise, 31(11), p. 1665. Available at: https://doi.org/10.1097/00005768-199911000-00025.
Borszcz, F. et al. (2018) “Functional threshold power in cyclists: Validity of the concept and physiological responses,” International Journal of Sports Medicine, 39(10), pp. 737–742. Available at: https://doi.org/10.1055/s-0044-101546.
Buchheit, M. and Laursen, P. (2019) Science and application of high-intensity interval training: Solutions to the programming puzzle. Champaign, IL: Human Kinetics Publishers, Inc.
Bundle, M.W. and Weyand, P.G. (2012) “Sprint exercise performance: does metabolic power matter? ,” Exercise and Sport Sciences Reviews, 40(3), pp. 174–182. Available at: https://doi.org/10.1097/jes.0b013e318258e1c1.
Bundle, M.W., Hoyt, R.W. and Weyand, P.G. (2003) “High-speed running performance: A new approach to assessment and prediction,” Journal of Applied Physiology, 95(5), pp. 1955–1962. Available at: https://doi.org/10.1152/japplphysiol.00921.2002.
Burnley, M. and Jones, A.M. (2016) “Power–duration relationship: Physiology, fatigue, and the limits of human performance,” European Journal of Sport Science, 18(1), pp. 1–12. Available at: https://doi.org/10.1080/17461391.2016.1249524.
Coggan, A. (2003) “Level II coaching manual training and racing with a power meter: an introduction.”
Jones, A.M. et al. (2010) “Critical power: Implications for determination of v˙o2max and exercise tolerance,” Medicine & Science in Sports & Exercise, 42(10), pp. 1876–1890. Available at: https://doi.org/10.1249/mss.0b013e3181d9cf7f.
Jones, A.M. et al. (2019) “The maximal metabolic steady state: Redefining the ‘Gold Standard,’” Physiological Reports, 7(10), p. e14098. Available at: https://doi.org/10.14814/phy2.14098.
Joyner, M.J. and Coyle, E.F. (2008) “Endurance exercise performance: The physiology of champions,” The Journal of Physiology, 586(1), pp. 35–44. Available at: https://doi.org/10.1113/jphysiol.2007.143834.
Karsten, B. et al. (2015) “Validity and reliability of Critical Power Field Testing,” European Journal of Applied Physiology, 115(1), pp. 197–204. Available at: https://doi.org/10.1007/s00421-014-3001-z.
Karsten, B. et al. (2020) “Relationship between the critical power test and a 20-min functional threshold power test in cycling,” Frontiers in Physiology, 11. Available at: https://doi.org/10.3389/fphys.2020.613151.
Leo, P. et al. (2021) “Power profiling and the power-duration relationship in cycling: A narrative review,” European Journal of Applied Physiology, 122(2), pp. 301–316. Available at: https://doi.org/10.1007/s00421-021-04833-y.
Maffetone, P. and Laursen, P.B. (2020) “Maximum aerobic function: Clinical relevance, physiological underpinnings, and practical application,” Frontiers in Physiology, 11, pp. Article 296. Available at: https://doi.org/10.3389/fphys.2020.00296.
Mattioni Maturana, F. et al. (2018) “Critical power: How different protocols and models affect its determination,” Journal of Science and Medicine in Sport, 21(7), pp. 742–747. Available at: https://doi.org/10.1016/j.jsams.2017.11.015.
Morgan, P.T. et al. (2018) “Road cycle TT performance: Relationship to the power-duration model and association with FTP,” Journal of Sports Sciences, 37(8), pp. 902–910. Available at: https://doi.org/10.1080/02640414.2018.1535772.
Moritani, T. et al. (1981) “Critical power as a measure of physical work capacity and anaerobic threshold,” Ergonomics, 24(5), pp. 339–350. Available at: https://doi.org/10.1080/00140138108924856.
Morton, H. (1996) “A 3-parameter critical power model,” Ergonomics, 39(4), pp. 611–619. Available at: https://doi.org/10.1080/00140139608964484.
Muniz-Pumares, D. et al. (2019) “Methodological approaches and related challenges associated with the determination of critical power and curvature constant,” Journal of Strength and Conditioning Research, 33(2), pp. 584–596. Available at: https://doi.org/10.1519/jsc.0000000000002977.
Niemeyer, M. et al. (2022) “Is the maximal lactate steady state concept really relevant to predict endurance performance?,” European Journal of Applied Physiology, 122(10), pp. 2259–2269. Available at: https://doi.org/10.1007/s00421-022-05001-6.
Nixon, R.J. et al. (2021) “Steady-state $$dot{v}{text{o}}_{2}$$ above MLSS: Evidence that critical speed better represents maximal metabolic steady state in well-trained runners,” European Journal of Applied Physiology, 121(11), pp. 3133–3144. Available at: https://doi.org/10.1007/s00421-021-04780-8.
Peronnet, F. and Thibault, G. (1989) “Mathematical analysis of running performance and World Running Records,” Journal of Applied Physiology, 67(1), pp. 453–465. Available at: https://doi.org/10.1152/jappl.1989.67.1.453.
Poole, D.C. et al. (2016) “Critical power: an important fatigue threshold in exercise physiology. ,” Medicine & Science in Sports & Exercise, 48(11), pp. 2320–2334. Available at: https://doi.org/10.1249/mss.0000000000000939.
Puchowicz, M.J., Baker, J. and Clarke, D.C. (2020) “Development and field validation of an omni-domain power-duration model,” Journal of Sports Sciences, 38(7), pp. 801–813. Available at: https://doi.org/10.1080/02640414.2020.1735609.
Sanders, D. and Heijboer, M. (2019) “The Anaerobic Power Reserve and its applicability in professional road cycling,” Journal of Sports Sciences, 37(6), pp. 621–629. Available at: https://doi.org/10.1080/02640414.2018.1522684.
Sanders, D. et al. (2017) “Predicting high-power performance in professional cyclists,” International Journal of Sports Physiology and Performance, 12(3), pp. 410–413. Available at: https://doi.org/10.1123/ijspp.2016-0134.
Valenzuela, P.L. et al. (2018) “Is the functional threshold power a valid surrogate of the lactate threshold?,” International Journal of Sports Physiology and Performance, 13(10), pp. 1293–1298. Available at: https://doi.org/10.1123/ijspp.2018-0008.
Weyand, P.G., Lin, J.E. and Bundle, M.W. (2006) “Sprint performance-duration relationships are set by the fractional duration of external force application,” American Journal of Physiology-Regulatory, Integrative and Comparative Physiology, 290(3), pp. 58–65. Available at: https://doi.org/10.1152/ajpregu.00562.2005.
Whipp, B. et al. (1982) “A constant which determines the duration of tolerance to high intensity work. ,” Fed N Am Soc Exp Biol , 41(5), p. 1591.


