What a 2:42 Boston Marathon Looks Like Inside Athletica
May 18, 2026
Marjaana Rakai and Paul Laursen
What does a 2:42 Boston Marathon look like inside Athletica? We break down Matt Hudson’s race file using pace, heart rate, Workout Reserve, System Engagement, efficiency factor, and training load to show how smart pacing and consistent training produced a personal best.
The finish line gets the attention. But it's the data behind it that tells the real story. When Matt Hudson, one of our ADA community athletes crossed the Boston Marathon 2026 finish line in 2:42, the file he shared showed us exactly what smart training and racing looks like - and Exercise Physiologist, Dr. Laursen and I couldn't leave it alone.
Caption: Matt Hudson, BIB 2617 on the left, cheering on a friend and finishing Boston with PB.
“I helped pace my friend at Boston with the goal of helping him attempt to qualify for age group masters while simultaneously getting me to a PR! I felt strong throughout, and better than I ever have coming out of the Newton Hills. Crossing the finish line with reserve in the tank and a PR in the process is the kind of race that tells you the Athletica training is doing exactly what it should!” Matt Hudson.
Matt’s Boston Marathon Race File
Figure 1. Matt’s Boston Marathon race file showing pace, heart rate, workout reserve and system engagement. Workout reserve represents the ratio of real time pace to historical maximal mean pace. Here, it crosses zero at the half-way point means that Matt was in uncharted territory from that moment on. System engagement (upper right) shows the estimated aerobic, threshold, maximal oxygen uptake (VO2max), anaerobic and neuromuscular contributions to Matt’s marathon performance
Matt's Boston file (Figure 1) tells the story clearly. Pace and heart rate hold steady through the first half, exactly what you'd expect from someone focused on pacing a friend rather than racing. Athletica's System Engagement feature (upper right, Figure 1) shows all three energy systems were drawn on heavily across the effort: aerobic at 100%, threshold at 95%, and VO2max at 77%. That pattern maps closely to what we know about marathon physiology, where the aerobic system dominates but the upper systems still get called upon (Joyner & Coyle, 2008).
Efficiency Factor
Efficiency Factor is the ratio of output (speed or power) to input (heart rate). The higher the number, the better your aerobic engine is working. Good running economy drives this higher: more speed for less cardiovascular strain.
Matt's Efficiency Factor (Figure 2) came in at a whopping 1.92. For context, most well-trained endurance athletes sit above 1.8 on a good day, beginner runners often start under 1.0 and age-groupers typically sit somewhere in between around 1.0-1.5. A number like this tells you the athlete got a lot of speed per unit of heart stress. Matt’s efficiency factor suggests a well developed aerobic economy built over months.
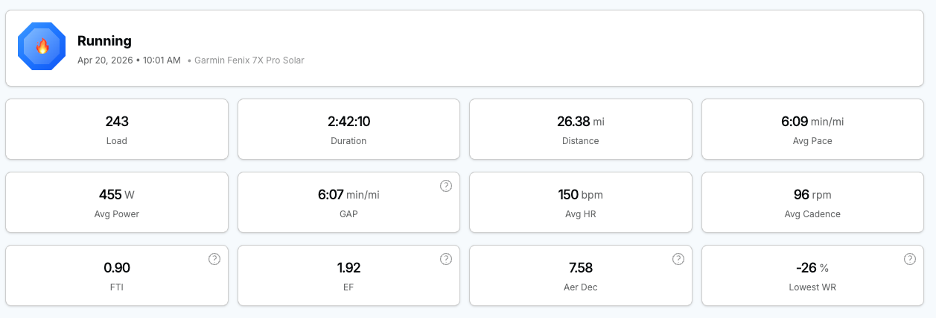
Figure 2. Matt’s key statistics from his Boston race file. While most markers are straightforward, the data additionally shows: 1) his 1.92 efficiency factor (EF) discussed above, 2) his aerobic decoupling value (Aer Dec; a ratio first and back half EF values), 3) his grade-adjusted pace (GAP; pace with hills taken into consideration), 4) his fractional threshold intensity (FTI; percent of threshold he ran at), and lowest workout reserve (WR; see Figure 1).
The Training that Enabled Matt’s Performance
Matt didn't get there by accident. But it's also not some genetic lottery result you can dismiss. Matt trained consistently using Athletica's core principles, and that training is what put him in a position to run his 2:42 in Boston.
So what are those principles?
1. Training Consistency. We say it time and time again. Training consistency is key. Figure 3 shows the training load Matt accumulated in the 9 weeks preceding Boston. Week after week he was able to consistently achieve a training load (stress) that put pressure on his system to adapt. This is also one of the hardest things for most athletes to actually do.
Figure 3. Matt’s Training Roadmap (predicted load or stress) across the preceding 12 months leading into the Boston marathon. The density and consistency of the nine week period before Boston would have enabled adaptive pressure to allow his body the ability to deliver his performance (Figures 1 and 2).
2. Training volume. In parallel with the first principle, the ability to maintain a consistently high training volume is a well established metric known to be related to marathon success (Muniz-Pumares et al., 2024). Matt also shined on this element achieving an average weekly running volume of 106 km/week in those nine weeks preceding Boston (Figure 3).
3. Downplay the importance of the long run. Matt’s longest run in the build phase period (Figure 3) was a mere2 hours! That’s it. This is highlighted (Figure 1) which shows an early negative workout reserve value by the halfway point. While Matt’s training diary shows frequent runs performed consistently to achieve his high volume, the message is clear.High frequency, consistent volume, similar stimuli repeated day after day. That's what built his fitness.
1. This post highlights Matt’s exceptional performance in Boston. While it does take a certain level of genetic aptitude, the principles behind it are those we can all apply to our own training. Train frequently and consistently, but never so much that it lowers your ability to complete your next session (remember, the most important session is the next session).
2. Use Athletica’s new System Engagement feature to examine the energy systems you are developing. Be sure that the easy training is truly easy for maximal aerobic development.
3. Avoid the long run fallacy.
4. Observe changes in efficiency factor and aerobic decoupling as you develop. Better yet, ask your Athletica AI-Coach how these are developing in you. High Efficiency Factor + low aerobic decoupling = well-paced, aerobically developed athlete with excellent running efficiency
Acknowledgements
Thanks to Athletica Development Athlete Matt Hudson for his willingness to share training and race files with us so we can all learn and benefit from.
Did you want your training and race files analyzed by experts? Submit your case here!
References
Joyner, M. J., & Coyle, E. F. (2008). Endurance exercise performance: The physiology of champions. Journal of Physiology, 586(1), 35–44. https://doi.org/10.1113/jphysiol.2007.143834
Muniz-Pumares D, Hunter B, Meyler S, Maunder E & Smyth B. (2024). The training intensity distribution of marathon runners across performance levels. Sports Med 55(4): 1023–1035.