Hydration for Endurance Athletes: How Much to Drink, and Why Losing Weight in a Race Is Normal
September 21, 2026
Paul Laursen
How much to drink during a marathon or Ironman, whether you need sodium, and why losing 2 to 3% body weight is normal.
I’ll declare my bias up front. I spent the better part of a decade measuring core temperature, body mass and blood sodium in athletes racing Ironman triathlons and cycling in climate chambers, and most of what I found contradicted what I’d been taught, and what I’d taught others, about hydration. So this post is partly a guideline and partly a confession [1].
Let’s start with why the advice went wrong in the first place.
1. The study that started the dehydration scare
In 1969, two South African physiologists, Cyril Wyndham and Nic Strydom, weighed runners before and after two 32 km races in Johannesburg and took their rectal temperatures at the finish [2]. They found that the runners who lost the most weight finished with the highest temperatures, and they gave the paper a title that did the rest: “The danger of an inadequate water intake during marathon running.”
But two details got lost in the retelling. The runner who won both races was also the most dehydrated and the hottest. And below about 2.5% weight loss there was no relationship at all, something the authors acknowledged in the text but obscured in the figure by starting the x-axis at 2% [1]. The finding was an association, in a field study, between weight loss and finishing temperature. It became, over the next 30 years, the belief that any dehydration raises body temperature and any rise in temperature risks heatstroke.
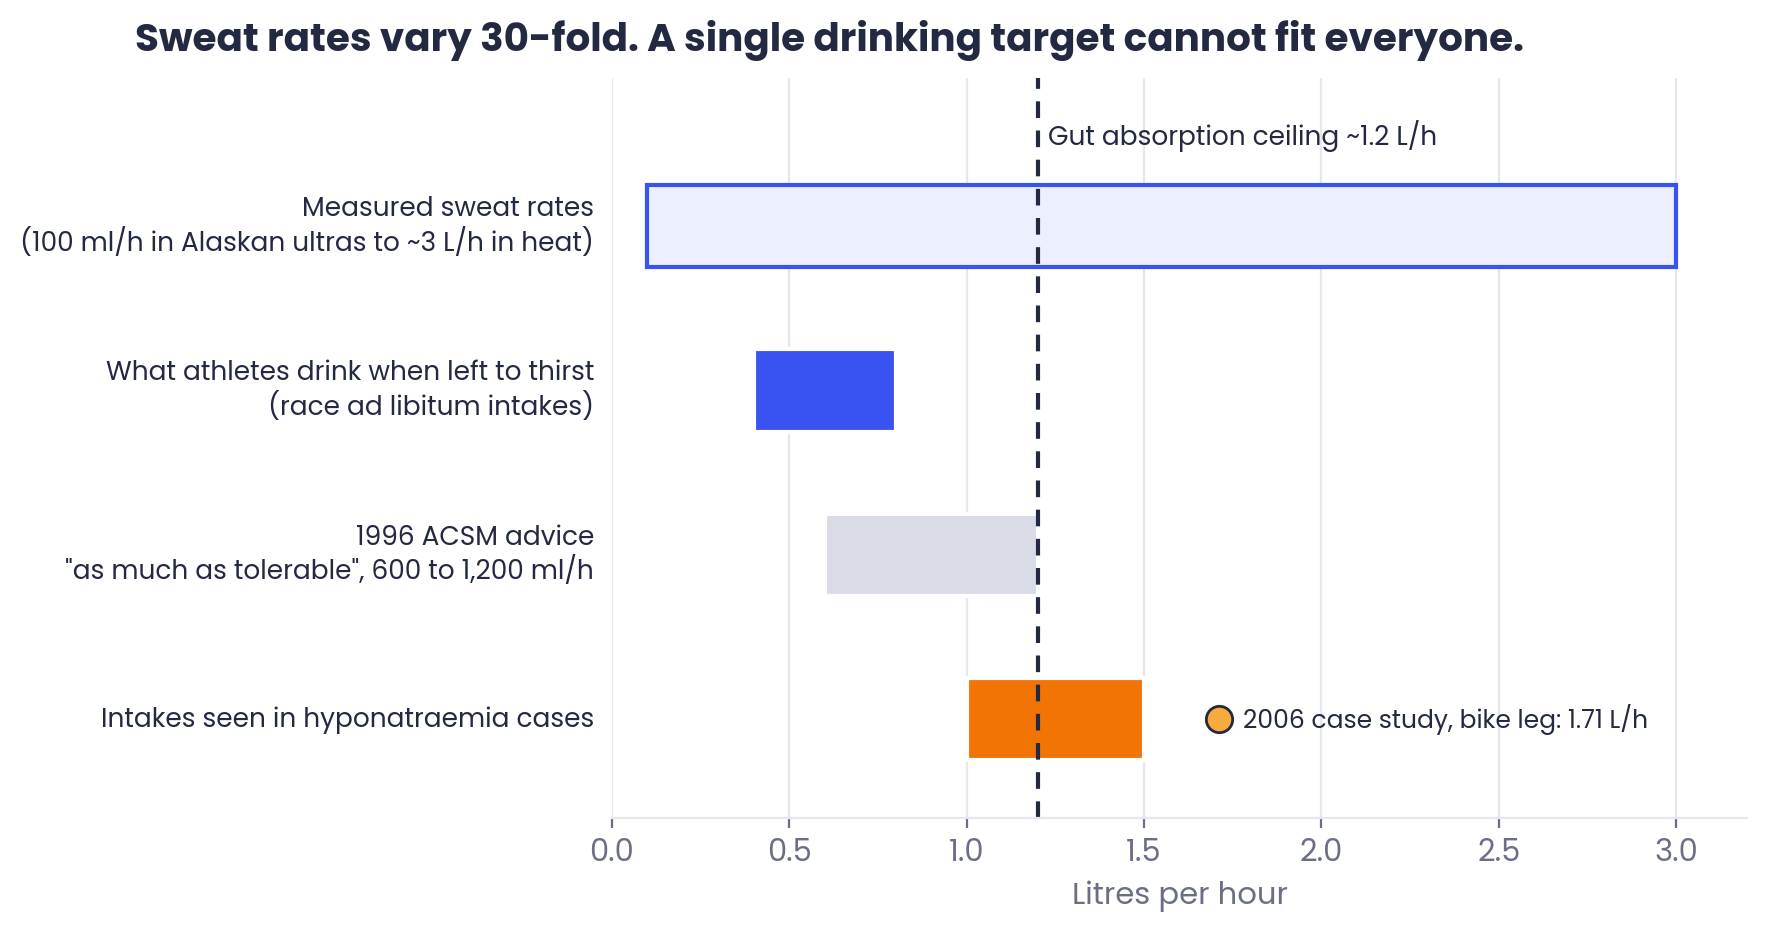
You can trace the drinking guidelines from there. The 1975 American College of Sports Medicine statement said to drink “frequently”. By 1987 it said fluid would reduce heat injury. By 1996 athletes were told to “consume the maximal amount that can be tolerated”, 600 to 1,200 ml per hour [3]. Only in 2007, after a run of hospitalisations and deaths from overdrinking that I’ll come to, did the ACSM retreat to “prevent more than 2% body mass loss” and concede that 400 to 800 ml per hour ad libitum was “probably satisfactory” [4]. Tim Noakes, it’s worth noting, had been saying pretty much exactly that since 1988 (Figure 1) [1].
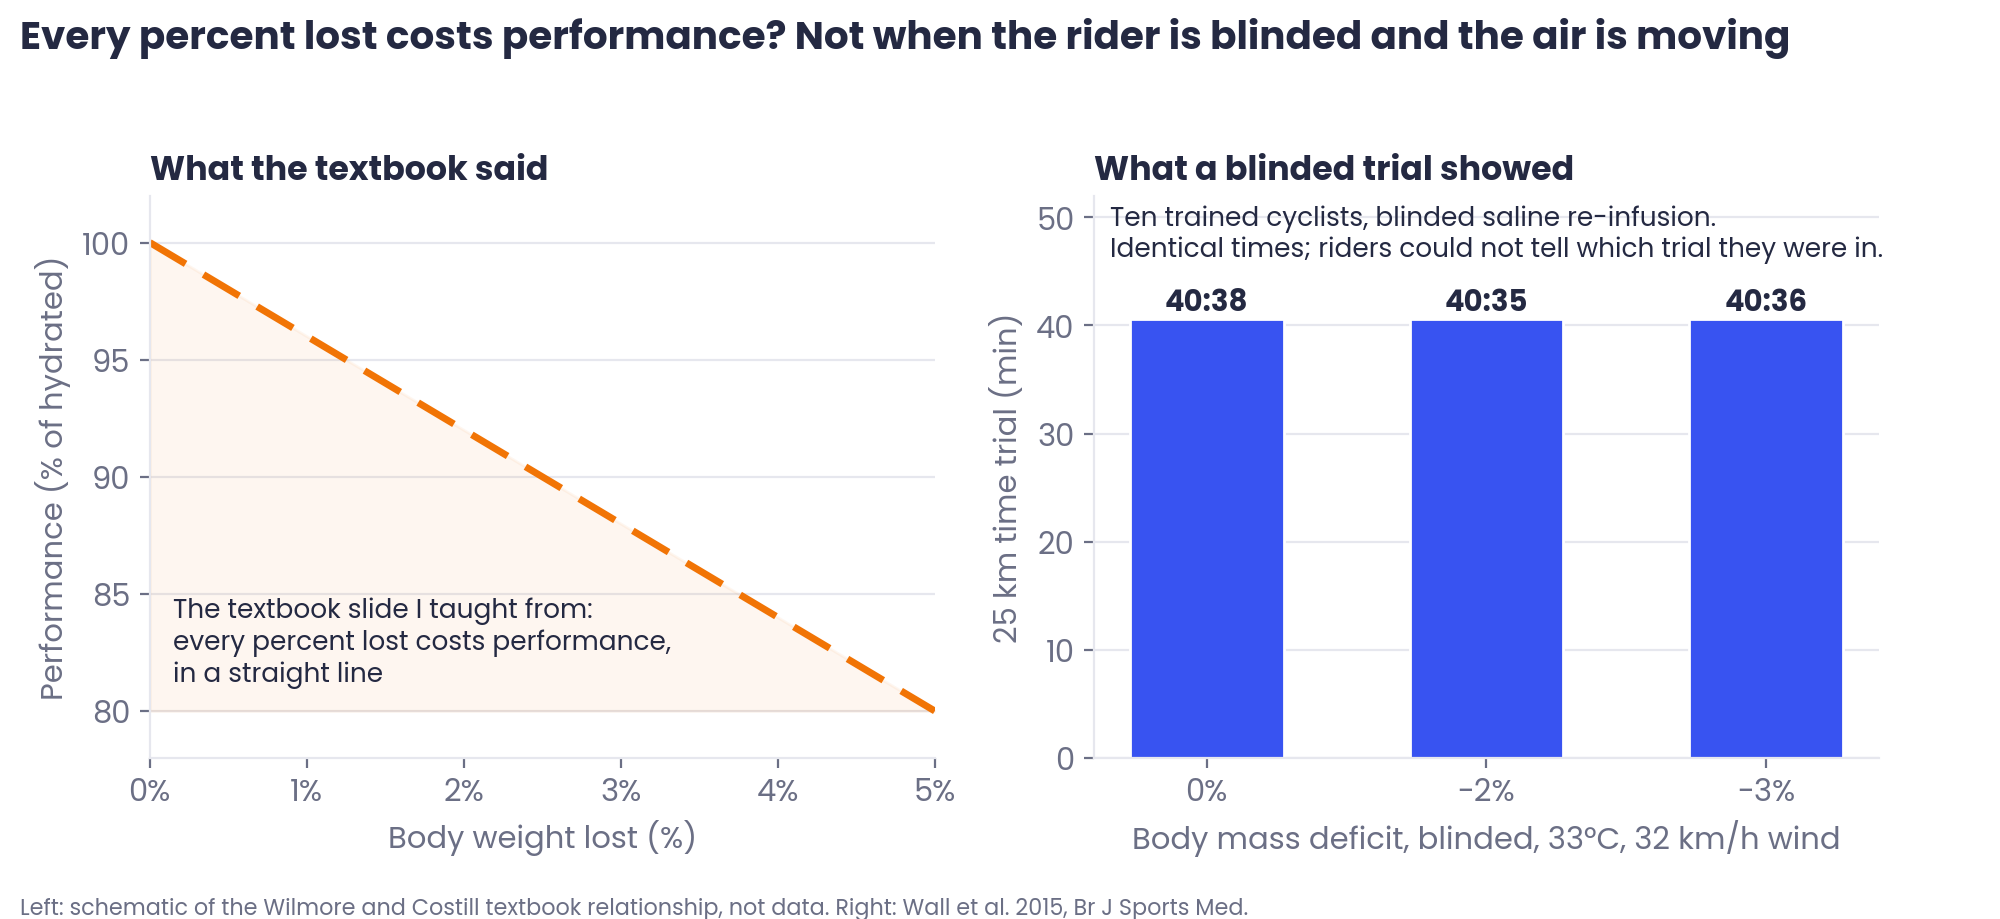
I taught the 1996 version. When I started lecturing in Perth I inherited the previous lecturer’s slides for “exercise in the heat”, straight from the Wilmore and Costill textbook: drink to match your sweat losses, or as much as you can tolerate, because performance falls in a straight line with every percent of body weight you lose. I wrote about that era a few years back, apology included. What I didn’t appreciate at the time was where the still-air climate-chamber studies behind those slides were being funded from, or why the Gatorade Sports Science Institute leaflets at every conference looked so much like journal articles. That penny dropped for me at the 2005 NSCA conference in Las Vegas, sitting in a Gatorade-sponsored session on cramping in front of a thousand colleagues and realising I was watching an infomercial. I stood up and said so, and when I asked the speaker afterwards what Gatorade was paying him, the answer, perhaps predictably, was “none of your business”. Fair enough. But it’s worth knowing that the “drink as much as tolerable” era had a sponsor.
Figure 1. Left: the relationship I taught from the textbook, a straight-line performance loss with every percent of body weight. Right: what ten blinded cyclists actually did at 0, -2 and -3% body mass, identical 25 km times (Wall et al. 2015).
2. What I found in the field
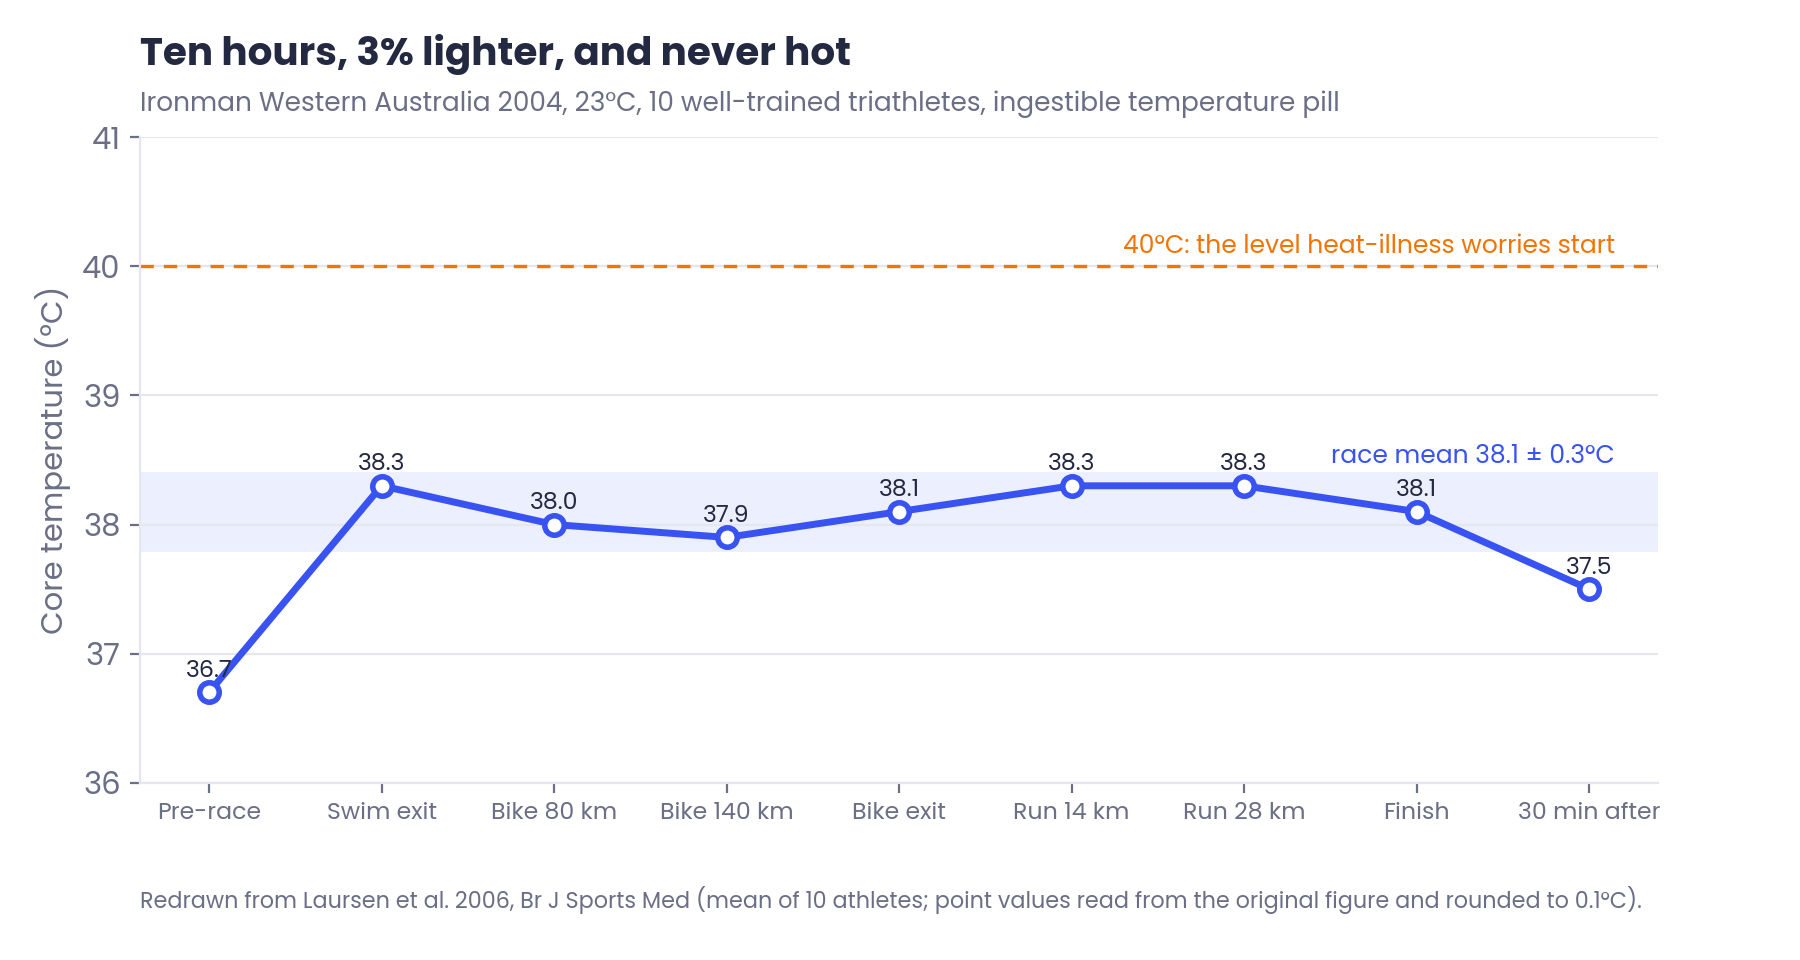
My entry to this topic was the Ironman. In 2004 we put ingestible temperature pills into 10 well-trained triathletes racing Ironman Western Australia and measured body mass, plasma sodium and urine specific gravity before and after [5]. Conditions were warm rather than brutal, 23°C and 60% humidity on average. The athletes finished in a little over 10 hours at 83% of maximum heart rate.
Busselton, 2004. Collecting core temperature by running alongside the athletes with the pill receiver: some of the first field data on temperature during an Ironman.
Figure 2. Core temperature across Ironman Western Australia 2004: a race mean of 38.1°C, never near 40°C, in athletes who finished 3% lighter (redrawn from Laursen et al. 2006).
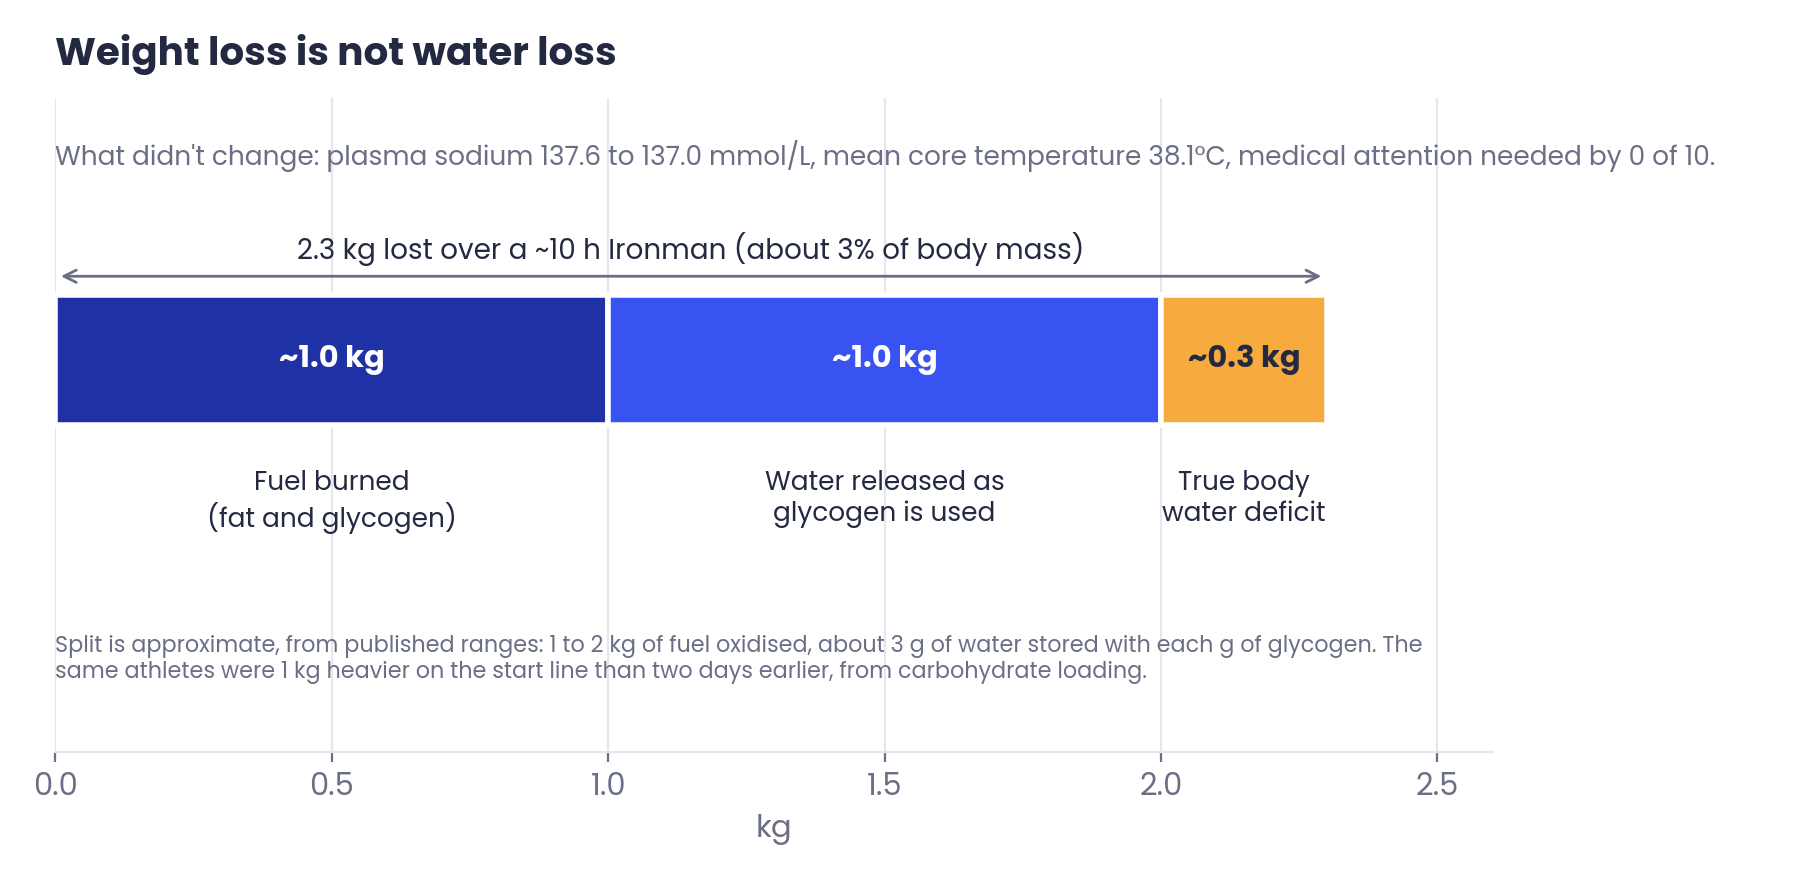
What did we find? Body mass fell by 2.3 kg, about 3%, and urine got more concentrated. But plasma sodium didn’t move (137.6 before, 137.0 after), and mean core temperature across the whole race was 38.1°C, roughly a degree above resting. Weight loss had no relationship with finishing core temperature, sodium or urine concentration, and none of the 10 needed medical attention afterwards. Nothing in that dataset looked like thermoregulatory failure to me, and these athletes had ignored the “replace everything you sweat” advice for 10 hours.
There’s a wrinkle here that matters for anyone who weighs themselves around a race. Our athletes were 1 kg heavier on the start line than they’d been two days earlier, almost certainly water stored with the carbohydrate they’d loaded. Each gram of glycogen carries about 3 g of water, so burning through 400 to 500 g of muscle glycogen releases over a litre that was never “hydration” in the first place [1]. Add the mass of fuel actually oxidised and you can lose 2 to 3 kg in a long race without your total body water falling by anything like that. So weight loss is not the same thing as dehydration. It’s a proxy, and a fairly poor one.
Figure 3. Most of the 2.3 kg these Ironman athletes lost was fuel and the water stored with it. Sodium and core temperature didn’t move.
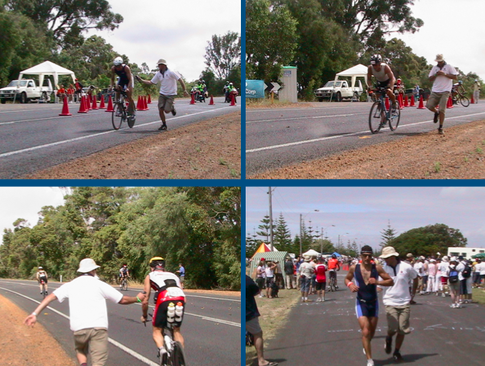
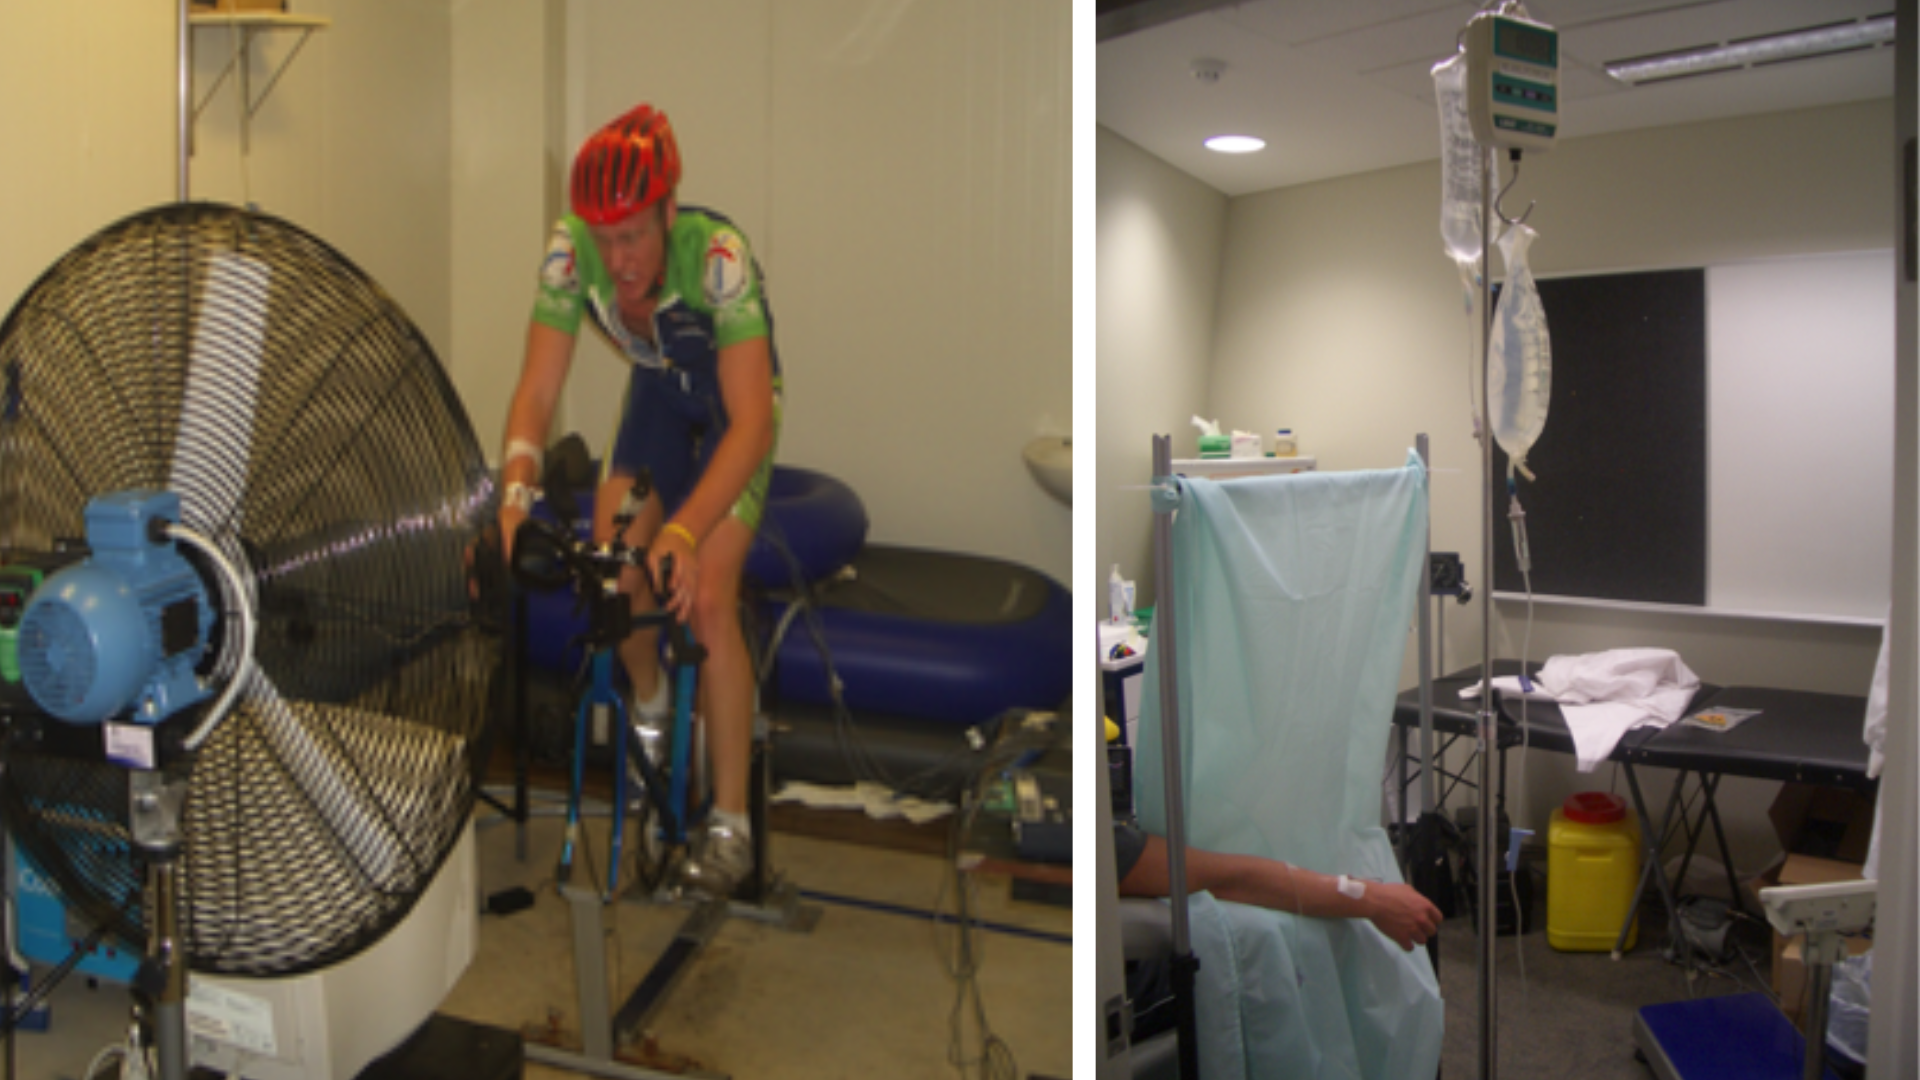
The obvious objection is that field studies can’t isolate cause, and the lab studies that shaped the guidelines were tidy. Montain and Coyle’s 1992 experiment had eight cyclists ride two hours at 33°C drinking nothing, 0.6, 1.4 or 2.4 L, and core temperature, heart rate and cardiac output tracked the fluid deficit in straight lines [20]. But those cyclists knew exactly which bottle they’d been handed, and the fan on them blew at only 8.6 km/h (4 mph). Saunders later repeated the design with realistic wind and most of the physiology stopped mattering, because the heat was being offloaded [22]. So Brad Wall in our lab did the hard version, with both of those problems fixed [6]. I’ve told the full story of that study before, so here’s the short one.
Left: the fix for problem one, 32 km/h of airflow, the piece most lab studies leave out. Right: the fix for problem two, saline bags behind a screen, so the rider never knew how much fluid he was getting back.
Ten trained cyclists were dehydrated to 3% body mass by two hours of walking and cycling in the heat, then, blinded, re-infused with saline to bring them back to 0%, 2% or 3% down. They then rode a 25 km time trial at 33°C with a 32 km/h (20 mph) facing wind, the piece most lab studies leave out, and we held their hydration constant by infusing saline at their sweat rate. Finishing times were 40:38, 40:35 and 40:36; identical. Rectal temperature was about 0.3°C higher in the last third of the 3% trial and nothing else differed, including how hard the ride felt. The cyclists couldn’t even tell which condition they were in. When the athlete doesn’t know how dehydrated they are, and the air is moving as it does on a road, 3% seems to cost nothing measurable over 40 minutes. Stephen Cheung’s group later replicated the design, adding a mouth rinse to take thirst out of the picture, and found the same [21].
3. The case that taught me the other half
I don't want to leave the impression that fluid balance never matters, because I've watched it go wrong, and the athlete it went wrong for was me. In December 2006 I raced Ironman Western Australia, my eleventh Ironman, wired up as my own case study: a core temperature pill, a stride sensor for pace, and blood sodium drawn before the start, at each transition, at the halfway point of the run and after the finish [7]. From earlier lab work I knew my sweat rate was about 1.42 L per hour and my critical core temperature, the point where I'd stopped in every time-to-exhaustion test, was 39.1°C.I drank 9.25 L across the swim and bike, 1.71 L per hour on the bike, more than I was sweating. It was a hot day and that seemed like the sensible thing to do. My sodium held at 139 to 140 mmol/L through to the run.
Then, 50 minutes into the marathon at 33°C, my core temperature hit 39.4°C, above my lab ceiling, and I slowed from 12.4 to 10 km/h. At halfway my sodium had dropped to 131 mmol/L. Severe leg cramps followed, I was walking at 6 km/h, and I finished the worst of the 17 Ironmans I have done in 11:38, having lost 2% of my body mass, with sodium still falling two hours after the race (Figure 4). So here was an athlete who was, by the scales, dehydrated, and by the blood, hyponatraemic. Both at once.
Figure 4. My own Ironman Western Australia 2006, redrawn from the published case report. Top: core temperature (dark line) against speed (blue), with my lab-measured critical core temperature at 39.1°C. Middle: heart rate against the two ventilatory thresholds. Bottom: blood sodium at the start, both transitions, halfway through the run and the finish. Drinking 1.71 L/h on the bike against a 1.42 L/h sweat rate preceded the sodium fall, the cramp and the walk.
The most likely explanation, in my view, is that heat and overdrinking on the bike set up fluid retention, the same inappropriate antidiuretic hormone response Noakes describes in the athletes who collapse with low sodium [1, 8]. The cramps, for what it's worth, are probably better explained by the neural fatigue model than by salt loss, since every field study that has looked has failed to find electrolyte differences between crampers and non-crampers [1]. The lesson I took away was simple, and I took it personally: drinking above your sweat rate because the day is hot is exactly backwards.
4. Why overdrinking, not dehydration, is the real medical risk
By the time Waterlogged was published in 2012, Noakes had traced more than 1,600 cases of exercise-associated hyponatraemia in the literature, including 11 deaths. He’s yet to find a single documented case of an athlete becoming critically ill from dehydration alone during a race with fluid available. That asymmetry should shape how we advise people.
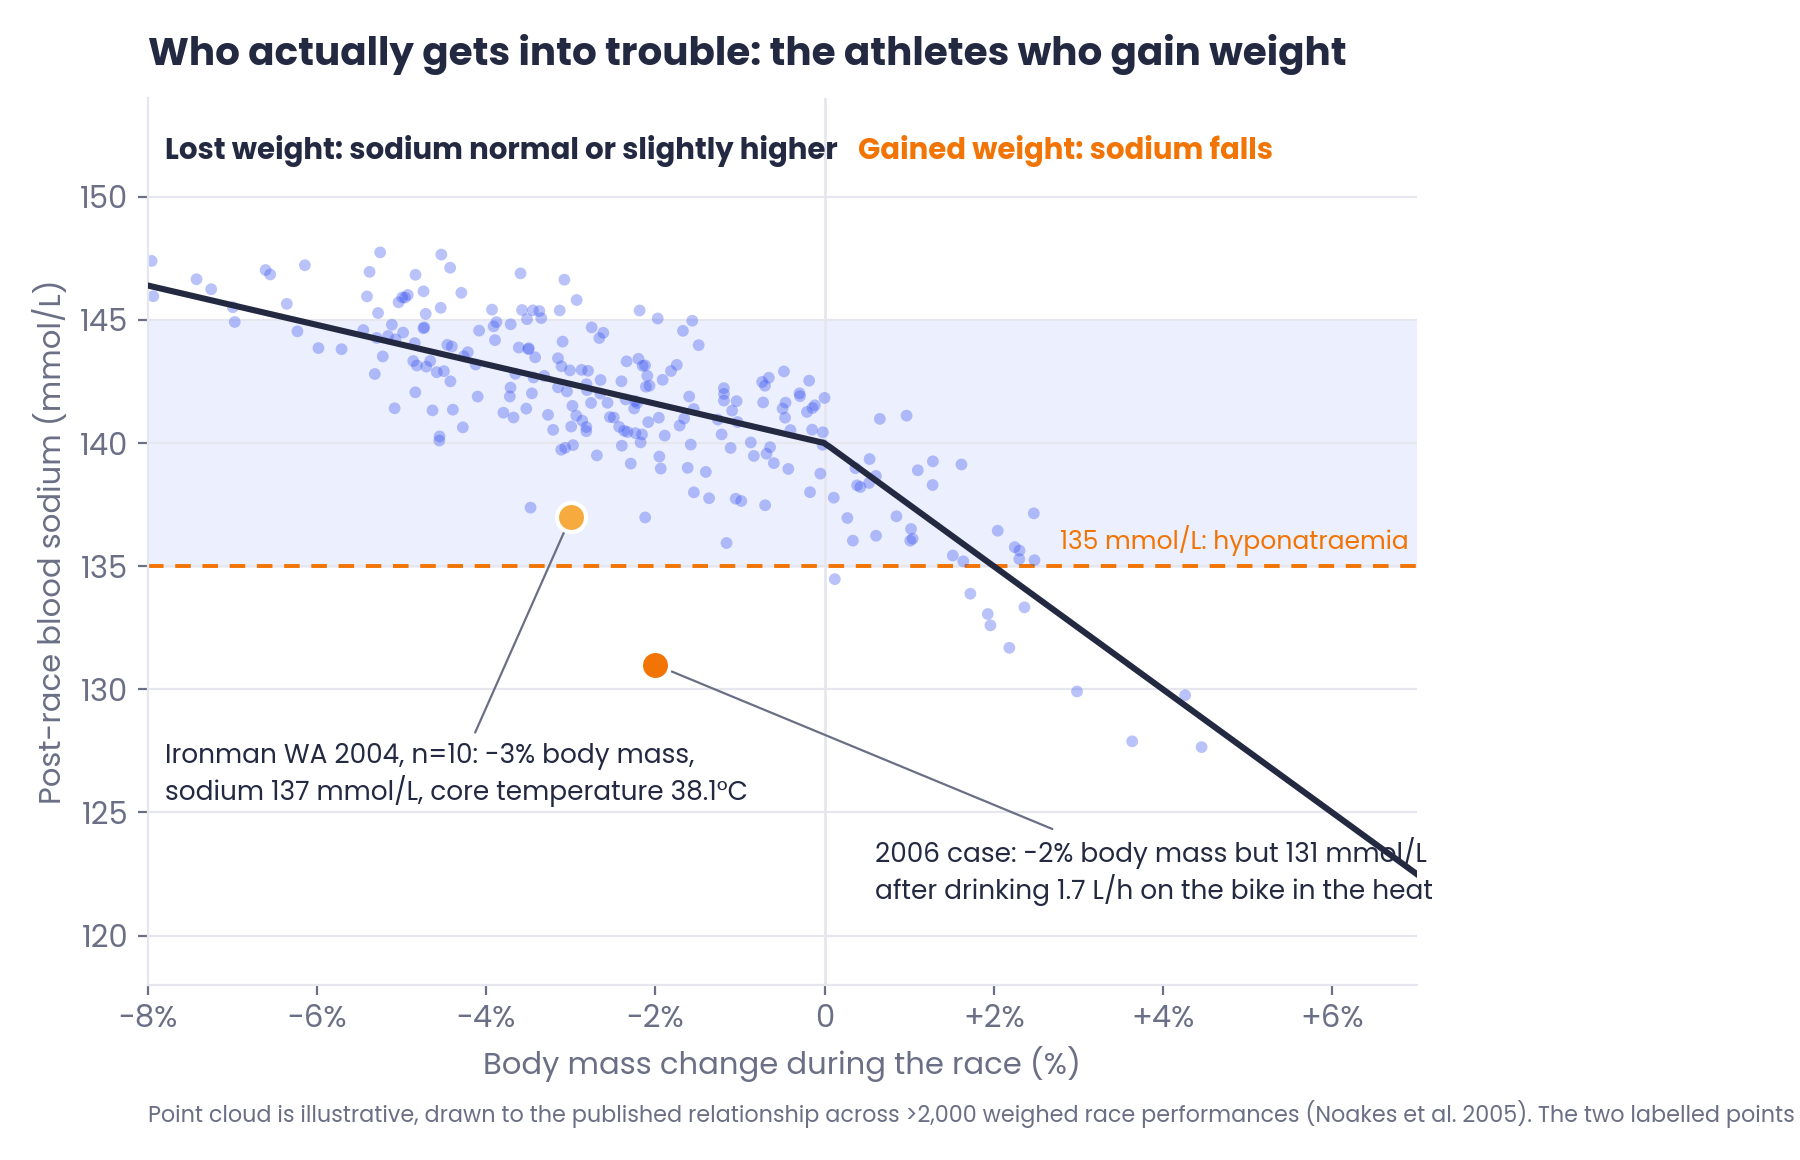
The mechanism was settled, at least to my satisfaction, by 1991. Tony Irving collected every millilitre of urine from eight Comrades runners recovering from hyponatraemic encephalopathy and found each was in positive fluid balance, carrying 2 to 6 L of excess water, and none had a meaningful sodium deficit [8]. Speedy’s New Zealand Ironman work confirmed it: post-race sodium falls in the athletes who gain weight, not the ones who lose it [9]. And when the Cape Town consensus group pooled 2,135 weighed performances across marathons, ultras, Ironman and long-distance cycling, the same negative line ran through all of it [10].
Figure 5. Across more than 2,000 weighed race performances, blood sodium falls in the athletes who gain weight, not the ones who lose it. Losing 2 to 4% is the normal, safe outcome of a long race. The point cloud is illustrative; the two labelled points are real.
The Boston Marathon study makes the risk profile concrete. Chris Almond’s team sampled 488 finishers in 2002 and found the odds of hyponatraemia rose with weight gain, drinking more than 3 L during the race, drinking at every mile, finishing slower than four hours, female sex and low body mass index [11]. Whether they’d drunk water or a sports drink made no difference. From that sample the authors estimated 1,900 of the 15,000 finishers were hyponatraemic to some degree. The same year, a 28-year-old runner in that race died of it.
Notice who’s at risk. Not the fast, heavy, hot sweaters the guidelines were written for, but slower, lighter athletes with hours of aid stations in front of them, doing exactly as they’ve been told. That’s the group I most want reading this.
5. Do endurance athletes need sodium? Salt tablets, cramps and the salty sweater
This is the section that will annoy some readers, so I’ll give the evidence first and then the practical concession.
The body defends its sodium really hard, harder than most of us appreciate. Jerome Conn showed this in the 1940s in men exercising six hours a day in 32°C heat, sweating 5 to 7 L daily, while their salt intake was cut from 14 g to 3 g. Within days their kidneys, then their sweat glands, cut sodium losses until output matched intake exactly, via aldosterone [1, 12]. David Costill later found the same in athletes drinking a sodium sports drink over five days of heat work: the extra sodium simply appeared in the urine [13]. Sweat sodium in marathoners ranges from 7 to 91 mmol/L, all of it below the 140 mmol/L of blood, which means sweating alone can only concentrate your blood sodium, never dilute it [14]. Fitness and heat acclimatisation together roughly halve it again, from around 80 to 40 mmol/L in Noakes’ table [1].
So where does that leave electrolyte products? Sodium in a drink does two real things: it speeds water absorption in the gut and, at higher concentrations, it reduces urine losses so you retain more of what you drink, which is why it’s clearly useful in recovery drinks [1]. What it does not appear to do, on the evidence, is prevent hyponatraemia (the Boston data), prevent cramps (Schwellnus’ Two Oceans and Ironman studies, and Hoffman’s 161 km ultra data, all negative for a fluid or electrolyte cause) or improve performance [1]. Some very experienced ultrarunners do crave salt late in 100-milers and feel better for it. But the doses involved, about 200 mg per hour, are a fraction of what’s lost in sweat, which suggests the effect isn’t really about replacement.
6. Does dehydration hurt performance? An honest answer
I’d have said no in 2007. The problem, as I see it, is blinding. If you tell a cyclist they’re dehydrated, they ride worse, even when they aren’t. When British groups fed unknown volumes through a nasogastric tube so the athlete couldn’t know, 2 to 3% hypohydration in the heat did reduce time-trial performance, at least when little or nothing was drunk during the ride [15]. Against that sit Goulet’s meta-analyses of exercise-induced dehydration in time trials, which find no effect [16], and our own blinded data with realistic airflow [6].
My reading is that the effect of a 2 to 3% loss is probably small enough to hide inside the noise of a lab study, and smaller still in the field, where the brain paces you and a headwind cools you. Elite men and women in the 2017 Singapore Marathon lost over 4% of body mass at 28°C and 75% humidity and finished in the top 12 with no medical issues [17]. Trained subjects marching 25 km in 44°C dry heat, drinking water when thirsty, lost up to 3 kg, kept total body water, sodium and osmolality in the normal range and stayed cool by pacing and resting [18]. Thirst, it turns out, may be a better regulator than any of us gave it credit for.
7. Hydration guidelines for endurance athletes: before, during and after
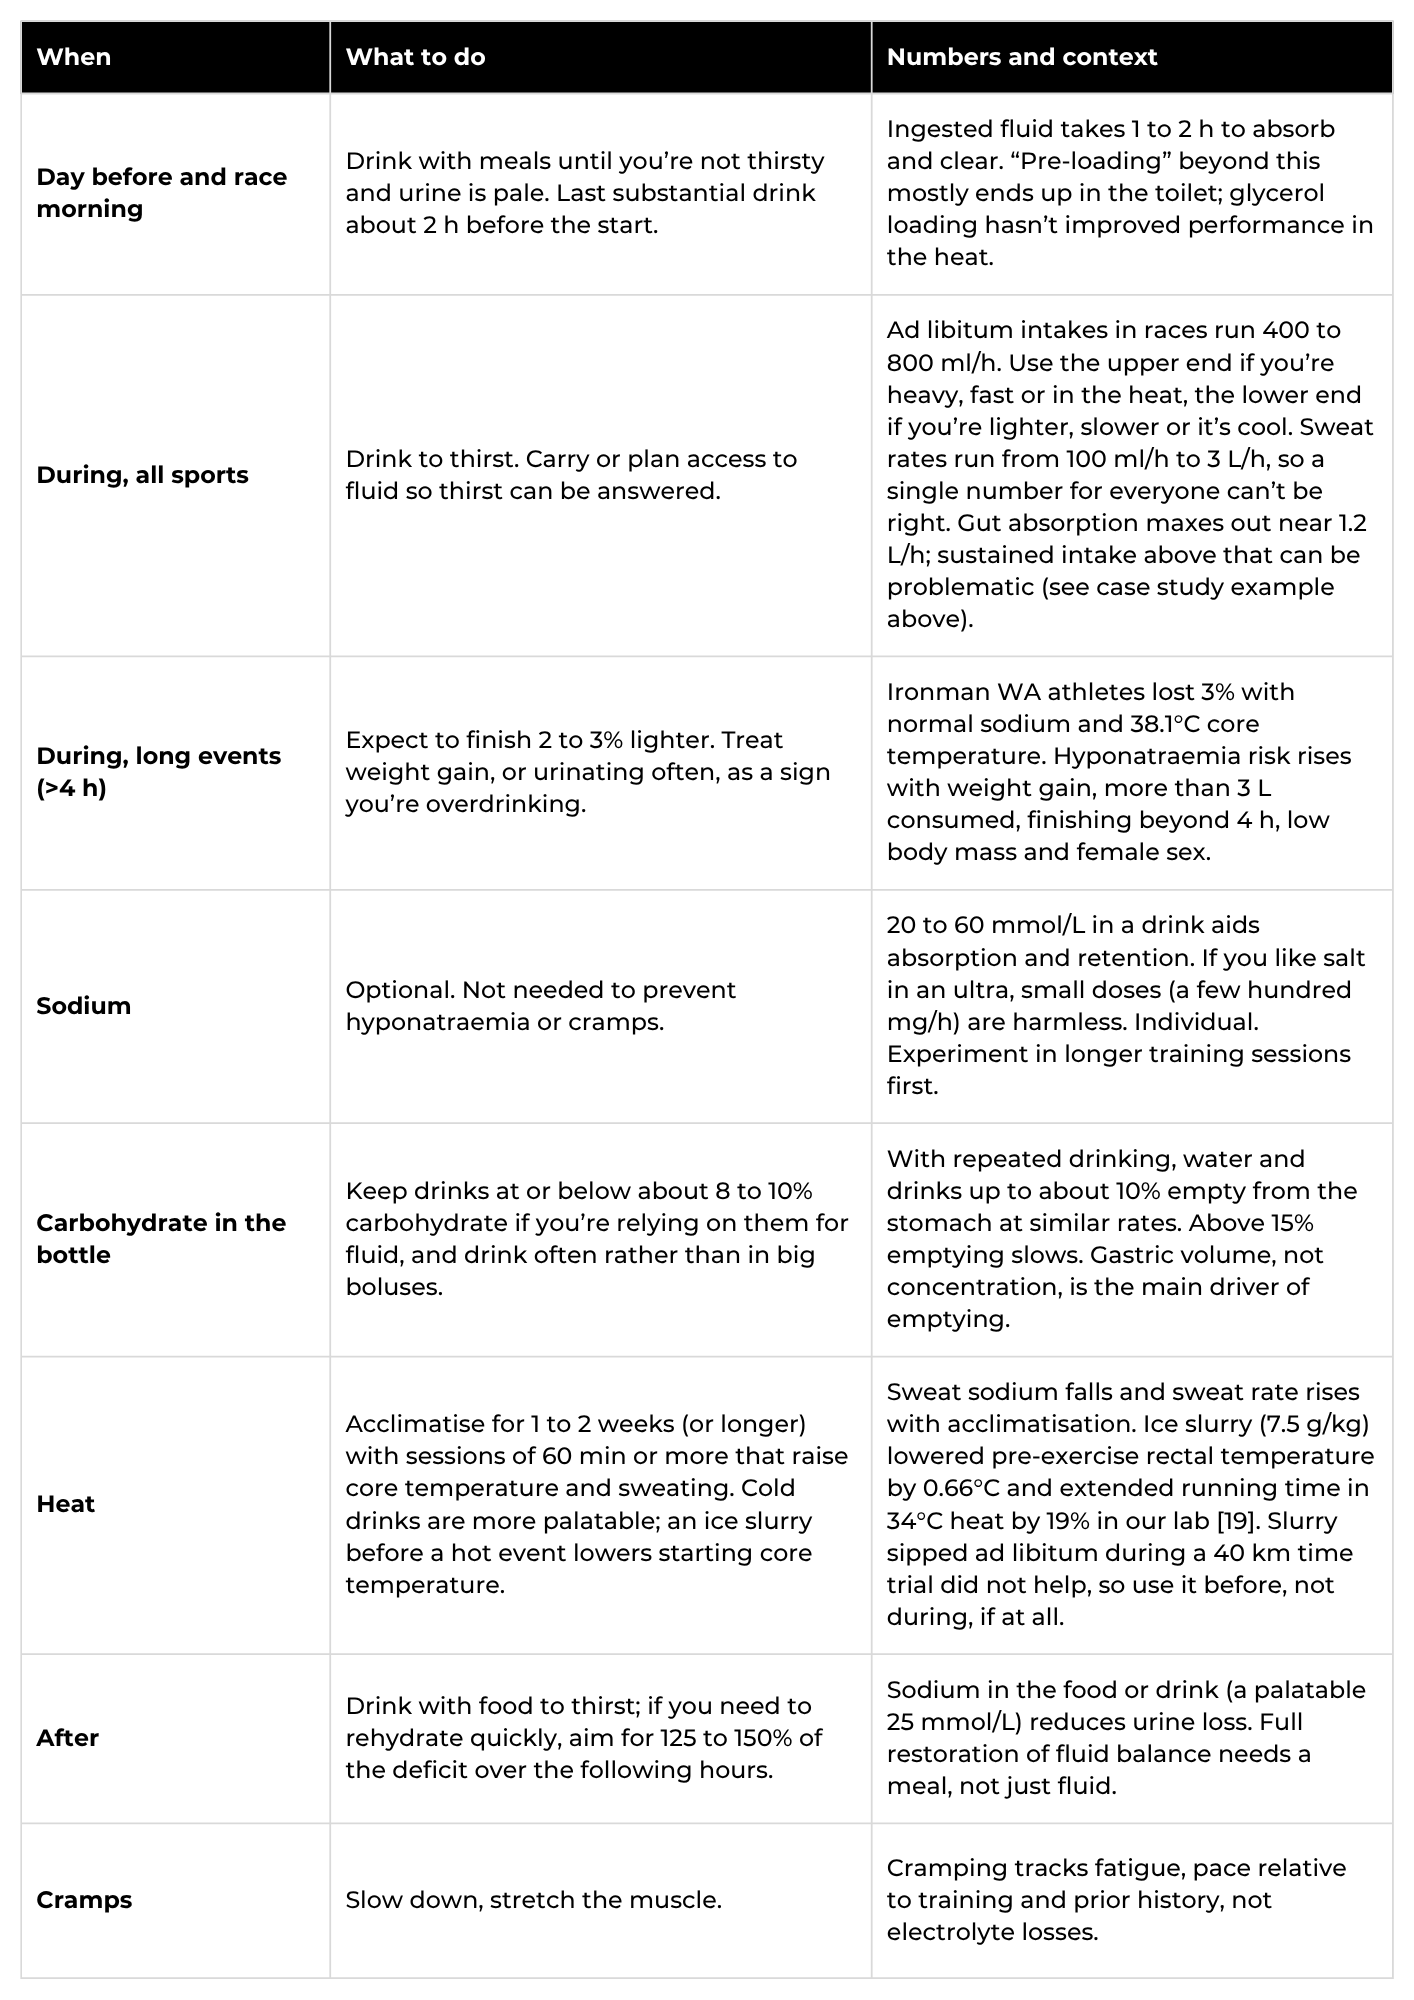
Here’s what I’d give an athlete I coach, and what we’ve given the Athletica AI coach [1]. I’ve kept the numbers because people ask for them, but read the first column of each row as the rule and the numbers as the context.
Figure 6. Sweat rates vary 30-fold between athletes and conditions, and the gut absorbs about 1.2 L/h. Thirst is the only regulator that scales with the individual.
For me, as someone who advises coaches and athletes on this for a living, the take is this: drink when thirsty, don’t plan to replace everything you sweat, and be more worried about the athlete who gains weight than the one who loses it. And to be clear, I’m not telling anyone to withhold fluid. Availability matters. The mistake was never drinking; it was drinking to a schedule written for someone else’s sweat rate.
Ready to follow a plan built by science for your endurance event?
Athletica adapts your load, recovery, and progress week by week.
How much should I drink per hour during a marathon or Ironman? Drink to thirst. Measured ad libitum intakes in races sit between 400 and 800 ml per hour, higher for heavier, faster athletes in heat and lower for lighter or slower athletes in cool conditions. The intakes seen in hyponatraemia cases, 1 to 1.5 L per hour sustained for hours, buy no performance and carry real risk [1, 4, 11].
Is losing 2% of body weight during exercise dangerous? No. Well-trained triathletes lost 3% in an Ironman with normal blood sodium and an average core temperature of 38.1°C, and elite marathoners have lost more than 4% in tropical heat while winning [5, 17]. Part of that weight is stored glycogen and its water, not lost body water [1].
Do I need electrolyte tablets to prevent hyponatraemia? No. Hyponatraemia is caused by drinking more than you lose and retaining it, and drinking a sodium-containing sports drink instead of water made no difference to sodium levels in the Boston Marathon study [8, 11]. Sodium in a drink does improve fluid absorption and retention, which is why it’s useful after exercise.
Do salt tablets stop cramps? The field studies say no. Runners and triathletes who cramp have the same blood electrolytes and hydration as those who don’t; cramping tracks fatigue, running faster than trained for, and a history of cramping. Stretching the affected muscle works because it resets the reflex [1].
Should I drink before I feel thirsty? Not on the evidence. “Drink ahead of thirst” plans have not consistently outperformed drinking to thirst, and they increase bloating and the risk of overdrinking [1]. Thirst tracks blood osmolality, which is the variable your body is actually defending.
What are the warning signs of overdrinking? Gaining weight during an event, urinating frequently while still drinking, bloating, and, later, headache, confusion or nausea. Not passing urine while drinking large volumes is not proof of dehydration; it can be fluid retention. Anyone confused after a long event needs a blood sodium measurement, not an IV drip [1].
Should I do a sweat rate test? If you’re curious, yes; it tells you whether you’re a 500 ml per hour person or a 2 L per hour person. But sweat rate changes with pace, heat, wind and acclimatisation, so one session’s number doesn’t transfer to race day, and matching it litre for litre is the mistake the 1996 guidelines made [1]. Treat it as an upper bound on what you’d ever need, not a target, and expect to drink well under it.
What are the signs of dehydration while running or cycling? Thirst, and that’s the one that matters. Darker urine and a dry mouth follow. In the classic desert studies, soldiers who drank nothing stopped at 7 to 10% body weight loss with a racing heart and dizziness on standing, and none lost consciousness [1]. An athlete who collapses after a long event is far more likely to have postural hypotension or hyponatraemia than dangerous dehydration.
What’s the best drink for a marathon or Ironman? Probably the one you’ll actually drink: cold and palatable. If you want fuel from the bottle, 6 to 8% carbohydrate with 20 to 60 mmol/L sodium empties and absorbs about as fast as water when you sip it regularly [1]. Plain water plus food works too. Above about 15% carbohydrate, gastric emptying slows.
Does dehydration reduce performance? The evidence is mixed. Blinded lab studies show a 2 to 3% deficit can slow a time trial in the heat when nothing is drunk; meta-analyses and our own blinded study with realistic wind show no effect [6, 15, 16]. Any effect is small and shrinks in the field, where pacing and airflow help.
References
Noakes TD. Waterlogged: The Serious Problem of Overhydration in Endurance Sports. Champaign, IL: Human Kinetics; 2012. (The updated argument appears in Chapter 4 of Lore of Running, 5th ed., in press.)
Wyndham CH, Strydom NB. The danger of an inadequate water intake during marathon running. S Afr Med J. 1969;43(29):893-896.
Convertino VA, Armstrong LE, Coyle EF, et al. American College of Sports Medicine position stand: exercise and fluid replacement. Med Sci Sports Exerc. 1996;28(1):i-vii.
Sawka MN, Burke LM, Eichner ER, Maughan RJ, Montain SJ, Stachenfeld NS. American College of Sports Medicine position stand: exercise and fluid replacement. Med Sci Sports Exerc. 2007;39(2):377-390. https://doi.org/10.1249/mss.0b013e31802ca597
Laursen PB, Suriano R, Quod MJ, et al. Core temperature and hydration status during an Ironman triathlon. Br J Sports Med. 2006;40(4):320-325. https://doi.org/10.1136/bjsm.2005.022426
Wall BA, Watson G, Peiffer JJ, Abbiss CR, Siegel R, Laursen PB. Current hydration guidelines are erroneous: dehydration does not impair exercise performance in the heat. Br J Sports Med. 2015;49(16):1077-1083. https://doi.org/10.1136/bjsports-2013-092417
Laursen PB, Watson G, Abbiss CR, Wall BA, Nosaka K. Hyperthermic fatigue precedes a rapid reduction in serum sodium in an Ironman triathlete: a case report. Int J Sports Physiol Perform. 2009;4(4):533-537. https://doi.org/10.1123/ijspp.4.4.533
Irving RA, Noakes TD, Buck R, et al. Evaluation of renal function and fluid homeostasis during recovery from exercise-induced hyponatremia. J Appl Physiol. 1991;70(1):342-348. https://doi.org/10.1152/jappl.1991.70.1.342
Speedy DB, Rogers IR, Noakes TD, et al. Exercise-induced hyponatremia in ultradistance triathletes is caused by inappropriate fluid retention. Clin J Sport Med. 2000;10(4):272-278.
Noakes TD, Sharwood K, Speedy D, et al. Three independent biological mechanisms cause exercise-associated hyponatremia: evidence from 2,135 weighed competitive athletic performances. Proc Natl Acad Sci USA. 2005;102(51):18550-18555. https://doi.org/10.1073/pnas.0509096102
Almond CS, Shin AY, Fortescue EB, et al. Hyponatremia among runners in the Boston Marathon. N Engl J Med. 2005;352(15):1550-1556. https://doi.org/10.1056/NEJMoa043901
Conn JW. Some clinical and climatological aspects of aldosteronism in man. Trans Am Clin Climatol Assoc. 1962;74:61-91.
Costill DL, Cote R, Miller E, Miller T, Wynder S. Water and electrolyte replacement during repeated days of work in the heat. Aviat Space Environ Med. 1975;46(6):795-800.
Lara B, Gallo-Salazar C, Puente C, Areces F, Salinero JJ, Del Coso J. Interindividual variability in sweat electrolyte concentration in marathoners. J Int Soc Sports Nutr. 2016;13:31. https://doi.org/10.1186/s12970-016-0141-z
James LJ, Funnell MP, James RM, Mears SA. Does hypohydration really impair endurance performance? Methodological considerations for interpreting hydration research. Sports Med. 2019;49(Suppl 2):103-114. https://doi.org/10.1007/s40279-019-01188-5
Goulet EDB. Effect of exercise-induced dehydration on time-trial exercise performance: a meta-analysis. Br J Sports Med. 2011;45(14):1149-1156. https://doi.org/10.1136/bjsm.2010.077966
Tan XR, Low ICC, Byrne C, Wang R, Lee JKW. Assessment of dehydration using body mass changes of elite marathoners in the tropics. J Sci Med Sport. 2021;24(8):806-810. https://doi.org/10.1016/j.jsams.2021.01.008
Nolte HW, Noakes TD, van Vuuren B. Trained humans can exercise safely in extreme dry heat when drinking water ad libitum. J Sports Sci. 2011;29(12):1233-1241. https://doi.org/10.1080/02640414.2011.587195
Siegel R, Maté J, Brearley MB, Watson G, Nosaka K, Laursen PB. Ice slurry ingestion increases core temperature capacity and running time in the heat. Med Sci Sports Exerc. 2010;42(4):717-725. https://doi.org/10.1249/MSS.0b013e3181bf257a
Montain SJ, Coyle EF. Influence of graded dehydration on hyperthermia and cardiovascular drift during exercise. J Appl Physiol. 1992;73(4):1340-1350. https://doi.org/10.1152/jappl.1992.73.4.1340
Cheung SS, McGarr GW, Mallette MM, et al. Separate and combined effects of dehydration and thirst sensation on exercise performance in the heat. Scand J Med Sci Sports. 2015;25(Suppl 1):104-111. https://doi.org/10.1111/sms.12343
Saunders AG, Dugas JP, Tucker R, Lambert MI, Noakes TD. The effects of different air velocities on heat storage and body temperature in humans cycling in a hot, humid environment. Acta Physiol Scand. 2005;183(3):241-255. https://doi.org/10.1111/j.1365-201X.2004.01400.x
.png)