Foreword by Filip Kolodziej
Nature is pleased with simplicity. And nature is no dummy.
Several months ago, I (Filip) wrote my first blog for Athletica on the future potential of using mathematically-modelled power profiling for guiding individualised training prescriptions. Alistair sent me a couple of pictures from his winter training to brighten up the blog. One picture caught my eye in particular. It was Alistair during his VO₂max laboratory test. What piqued my attention had nothing to do with double Olympic champion. It was the old-fashioned mouthpiece (and a painful-looking nose clip) used to collect his breathing air for the oxygen consumption measurement. I was struck by the idea that arguably one of the greatest triathletes in history was relying on archaic and cumbersome equipment instead of a modern face mask connected to a tiny collection wire.

Knowing Professor Paul Laursen has conducted and analysed hundreds, potentially thousands of such lab tests, I asked him if there is any scientific reason behind using this rudimentary technology. He answered: “From my experience, sometimes old is just best. When things are originally made, they only use simple first principles. Then we work towards getting really fancy thereafter, and if not treading carefully, we often mess things up. We could be guilty of this ourselves, but we are trying really hard to get the first principle basics right first, before we add anything too fancy on the top in Athletica.”.
This lesson given by Paul is the first thing that came storming to my mind when I started learning about and subsequently testing (I did several ugly HIIT protocols to see what it can do) Andrea Zignoli’s simple, yet novel method of quantifying any given exercise training session — now named Workout Reserve (WR). Simply speaking, Workout Reserve is an easy way of gaining insight into how much “gas remains in your tank” over different periods of time relative to what you’ve done in the past. As a physiologist, I am often guilty of searching for explanations behind the exercise performance deep in the metabolism and electrochemical state of the muscle cells. After multiple attempts of trying to pin Workout Reserve to a cellular or systemic mechanism, I finally understood… There is no need to! I see Workout Reserve as a simple, yet wonderful method of integrating all the physiological parts contributing to the mechanical work of exercise under one mathematical model. After all, as a famous Norwegian coach tends to advocate, what really matters at the end of the day, is the capacity to do more work i.e., swim, cycle or run faster for longer.
Thanks to the extensive work of one of our key developers, Bence Tamás, the remarkable WR is now finally implemented into the Athletica AI engine to work in tandem with our one-of-a-kind Workout Wizard feature. What Andrea and Bence have done reminds me of the 1985 classic “Back to the Future”. In this movie, an eccentric scientist Emmett Brown, also known as “Doc”, builds a time machine from an old sports car, powered by plutonium (I am not a great physicist, but I don’t think there is any scientific reason it would work). Similarly, in my eyes, Andrea took an old mathematical concept and re-purposed it, to sum up, the complex physiological intricacies of exercise performance in one figure, which is the Workout Reserve. Sounds like the Future to me…
In this blog, Andrea will provide you with background information on his WR model and examples of its utility in estimating physiological performance in cycling training. For those who want to take a deep dive into how the marker is derived, please read Andrea’s pre-print paper.
Why another model?
Building our own power or speed profile is one of the simplest physiological experiments we can carry out on our own with a basic set of wearables. Let’s walk through a pretty simple example of a method:
- Get on your bike (trainer or road);
- Warm up adequately;
- Begin working at a power output you know you can sustain for a short amount of time, like 12 minutes;
- Push and go all the way to exhaustion;
- Record the total duration of the effort.
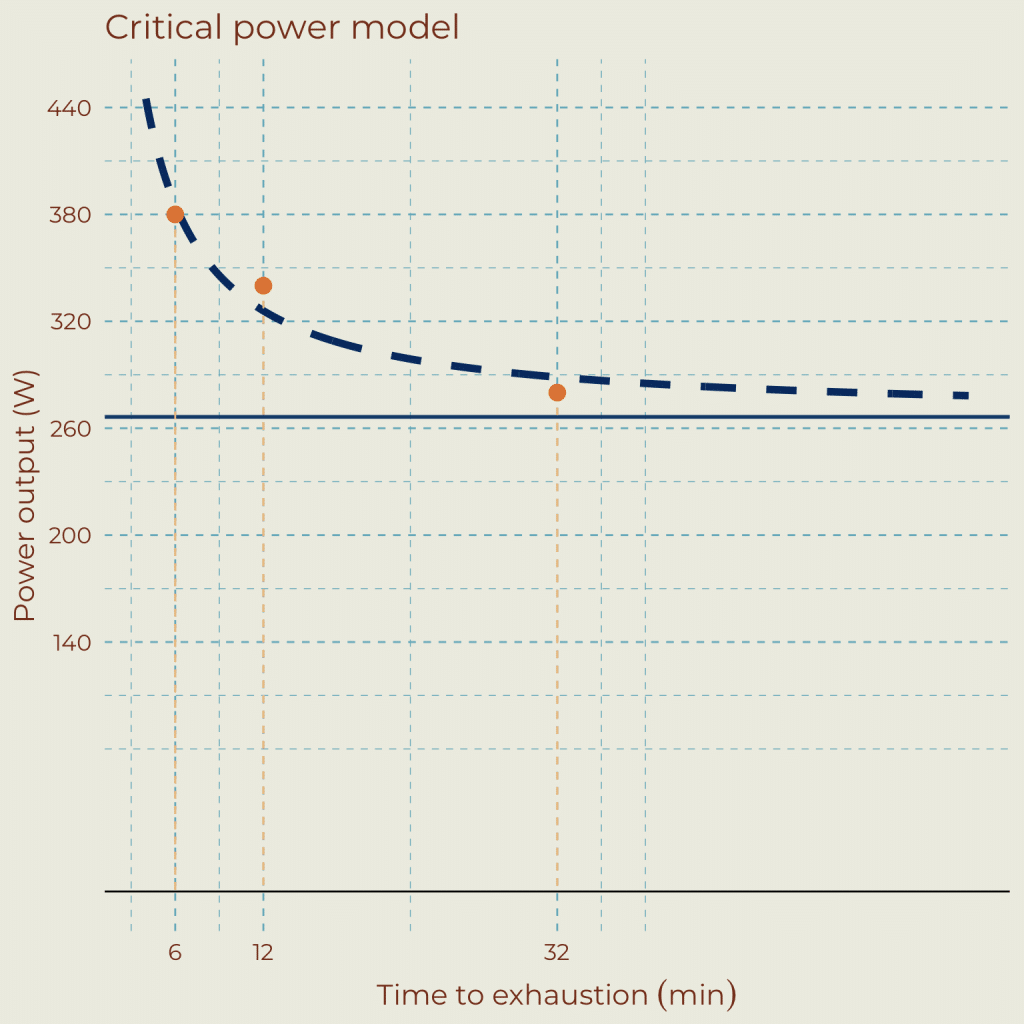
Congrats! You’ve just collected your first data point! Let’s assume you’re pretty strong and say your result was 12 minutes at 340 W.
Next, let’s try two other trials using a harder (shorter) and an easier (longer) power output. Be sure to be fully recovered before you set out on each of your trials. Let’s pretend you did this and collected two additional points as follows:
- 6 minutes at 380 W, and
- 32 minutes at 280 W.
With the collection of these points, we now have the core foundation of your power profile (Figure 1).
The power profile is a powerful tool. Let me illustrate. Maybe we’re wondering how long you can hold 400 or 300 W? Or perhaps we’re wondering what power output you can sustain for 40 minutes? To answer these questions, we can use two strategies:
- repeat the test all over across all the power outputs and durations you are interested in, or
- find an equation that provides those values for you.
Luckily, the equations that regulate the relationship between the power output and the time to exhaustion are already available; all you need are the values of your unique parameters. The most famous of these equations is the critical power model, which dictates that an inverse (hyperbolic) relationship exists between the power output and the time to exhaustion (Figure 1).
This relationship has two parameters, which are the unknowns that describe the unique shape of your power profile. Importantly, the two parameters of the critical power model have physiological meaning: one is the famous critical power (CP, which is a power output expressed in Watts, i.e., the horizontal asymptote), and the other is the W’ (energy or work above CP expressed in J, i.e., the area beneath the curve). To find your parameters, we need to “fit” the equation with your data, as we have done in Figure 1.
Let’s be careful though: if we have two parameters, we’ll need at least three points, i.e. three distinct maximal efforts for different combinations of power and duration. Usually, when a model is more complicated, the number of parameters is higher and more points are required. For example, we use a three-parameter version of the critical power model or the so-called omni-domain power-duration model (Puchowicz et al. (2020)) in Athletica.
In this blog post, we will put more of a focus on W’, which is the area on the power profile between the hyperbola and the horizontal asymptote (yes, an area under a power curve is an amount of work or energy; Figure 1). The mathematical properties of the hyperbola dictate that the area below the curve is constant, which translates into the same amount of work done by the anaerobic metabolic pathway when you did the exhaustion test at 580 W for 6 minutes, at 340 for 12 minutes or 260 at 30 minutes!
So far, we have only been discussing a situation where power output was constant, and effort was maximal to exhaustion. This is certainly not always the case. What happens when we want to estimate the time to exhaustion for interval training? Say for example that Athletica prescribes you a workout session at 400 W for 4-minute intervals. How many of those intervals could you sustain to exhaustion (you don’t have to, of course, but the question remains)? How does your Workout Reserve (for lack of a better term) or the gap between your current and best performance fluctuate over time? As you train, detrain, adapt, overreach, whatever? At least that’s what we wondered.
There is no straight answer to these questions, mainly because we don’t know with enough detail yet how fast the anaerobic energy sources are depleting and replenishing during intermittent exercise, or how the fatigue characteristics of the muscle fluctuate during high-intensity exercise. We have reason to think that the speed of recovery depends on the fatiguing status, the power output (impulse duration) of the previous bouts, and your unique physiological traits. However, at present, a single methodology able to accurately predict the fluctuations of the performance potential during high-intensity interval exercises is missing — or at least not available off the shelf for everyone — yet.
The concept.
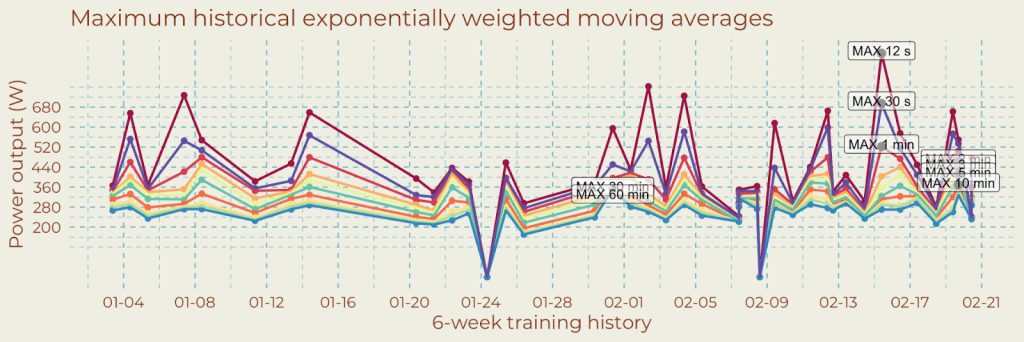
At Athletica, we love simplicity. So we always try our best to adopt a methodology that can minimize errors in the estimation of your Workout Reserve. This is suitable for large volumes of data from athletes/users. First of all, instead of asking you to complete time-to-exhaustion tests, we build your speed/power profiling chart using rolling averages. This is achieved by taking your previous 6 weeks of training and then computing the mean maximum values of different rolling averages, let’s say from a few seconds to an hour. What we come up with is reported here below: every session during the 6-week period has a maximum value. As you can see, the maximum values can be registered during different sessions (Figure 2). In a session where you have completed short bursts, you will likely have set records across short time spans. Vice-versa, during sessions with long intervals, you’ll likely have set records over longer durations.
The collection of these maximum values then creates your power or speed profile. An example of a power profile is shown in Figure 3.
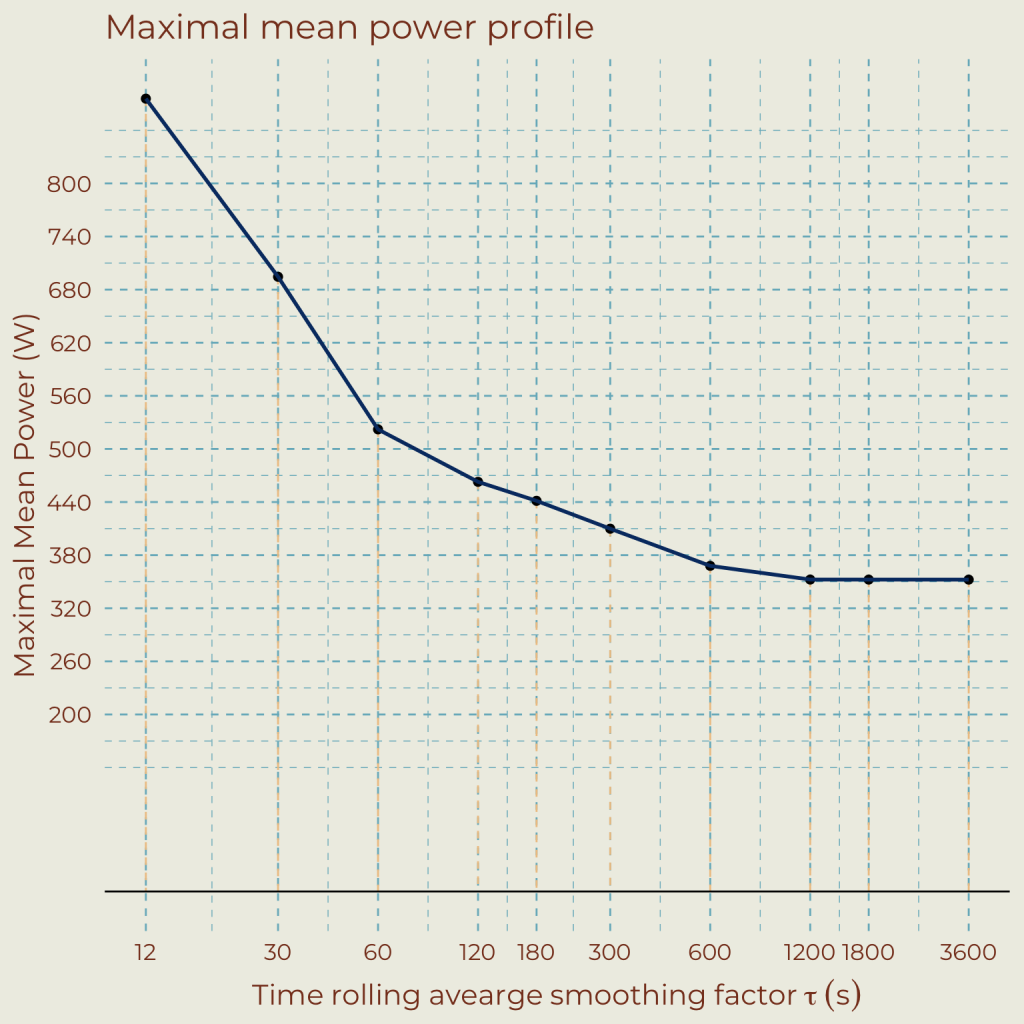
Now the idea here is really quite simple. To review, we’re trying to answer the important question: how long can I sustain a variable power output? Well, suppose the power profile is built with maximal efforts. In that case, the minimum difference between the rolling power output at different time points and your best efforts to date will dictate the gap between your current and best performance. In other words, your residual performance potential is the minimum ratio between your current rolling averages and your historical rolling averages. To extend the points of the power profile beyond the 1-h mark, you might want to use models such as the critical power or the omni-domain power-duration (OmPD) (Puchowicz et al. 2020) model.
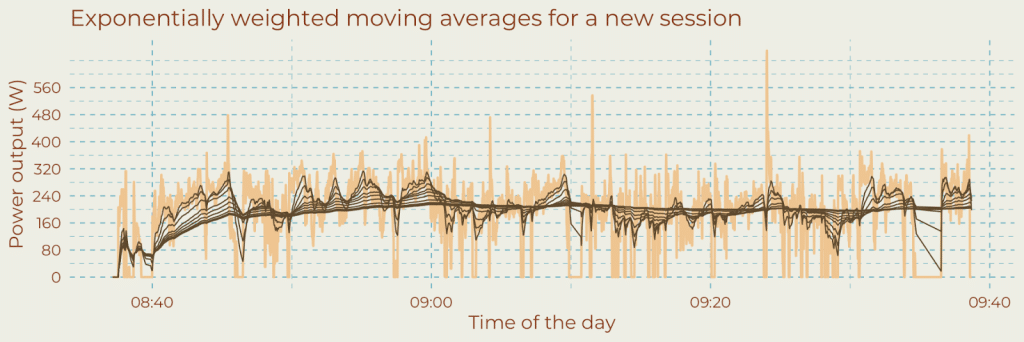
Let’s take a new session like the one shown in Figure 4. Here we have all the rolling averages plotted together alongside the actual power output of the session.
Putting it all together to form your Workout Reserve profile.
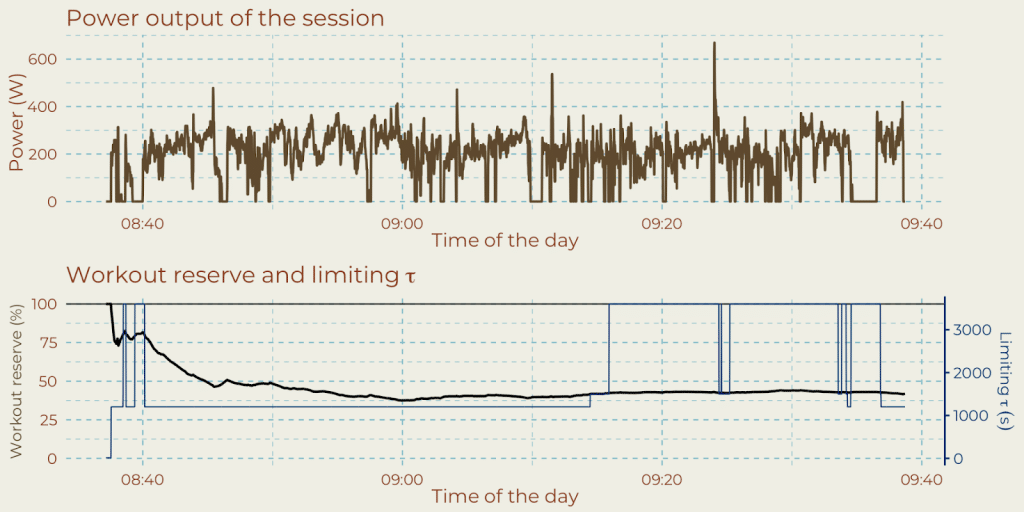
The background presented thus far is important to appreciate for those interested to know how Athletica works towards predicting your Workout Reserve. We use these concepts to provide an overall estimation of your best effort during a session and to provide you with additional insight into the data analysis. For example, an effort made over what duration limited your performance? Did you get closer to a record over short bursts or longer ones? In Figure 5 below, the effort illustrated originally in Figure 4 is now displayed alongside the calculation of the Workout Reserve (as a % of the maximum) and the duration of the effort closest to its maximum (we call it t (tau), for brevity). Here you will notice that when power output increases, the limiting time (secondary y-axis) is reduced.
Where is this implemented in Athletica?
On Athletica, you can find the concept applied to your training sessions, by clicking on the “Edit session data”, and then on the tab “Analysis – Session Chart”. An example is reported below, where you can see the “Workout Reserve (WR)” depicted with a purple dashed line.
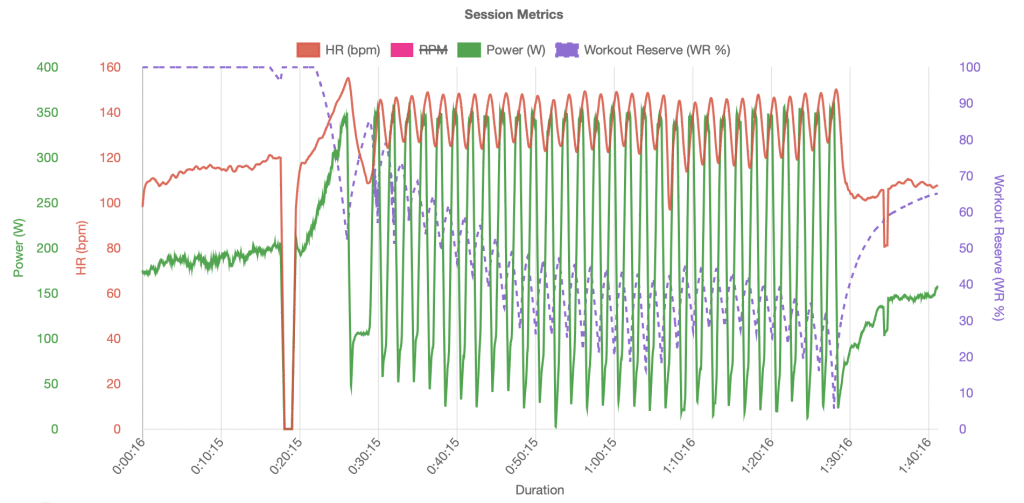
Disclaimer: please remember that you need to complete a power/speed profile to trigger the computation of this metric. In addition to that, remember that the reserve is computed from a recent 6-week training history. So, if the training history does not include maximal efforts, then your estimation might be misleading. Athletica implements a version of the proposed model described in an attempt to output reasonable numbers.
FAQ:
Q: Can you give me an easy example of how the number is actually computed?
A: Let’s assume that your rolling average closest to the historical maximum is the 30-min rolling average and, for the current exercise this is 260 W. If your best effort at 30-min (the 30-min point in your power profile) is 350 W, then your Workout Reserve for your current effort is 1-(260/350)x100%=25%.
Q: Why do you refer to a ratio towards maximum and then use a % which starts from 100?
A: We believe it’s more intuitive this way. At Athletica, we think that it is better to express maximum efforts when your Workout Reserve is close to 0%. So we assume when you are fresh you’ll be starting from 100%, and if you are close to your maximum your potential approaches 0%.
Q: What if my Workout Reserve becomes negative?
A: If the Workout Reserve becomes negative, that means you’ve set a new record and you must have been very close to your maximal potential (congratulations!). Before your next session, your power profile will be updated accordingly.
Q: Why is my Workout Reserve dropping to 50-60% after only a few minutes of exercise?
A: This simply means that there is a ratio of 0.25 between your current and best performance (the Reserve is computed with the difference starting at 100, i.e. 100-25%=75%). It doesn’t mean that you’ve already emptied 25% of your stores or anything like that.
Q: Why does my Workout Reserve never recover to 100%?
A: Remember that the Workout Reserve is always the difference between your current and best performance. So if your 1-h rolling average is 200 W and your profile says that your best 1-h rolling average is 240 W, then you have a ratio of 200/240 for that time, i.e.: 83% of the max and 17% remaining. However, as soon as you try to sprint, a shorter rolling average now becomes the limiting factor.
Q: What is the physiological meaning behind the Workout Reserve?
A: The adoption of this strategy comes at the cost of physiological meaning. This methodology only relies on processing techniques inherited from mathematics. Hence, there is currently no physiological meaning behind the concept. However, Athletica can still use the maximal rolling averages to build the power profile and estimate the critical power.
Q: What are the benefits of Workout Reserve vs. W’?
A: The benefit of Workout Reserve and its advantage over the W’ is that it’s a mathematical, not a physiology-derived construct. The likely fault in W’ is that It assumes an equivalent strain on the system across a variety of effort durations following the CP hyperbola. However, fatigue in the heavy and moderate domains is dynamic. Workout Reserve, therefore, is an umbrella that encapsulates physiology (integration of systems: nervous, respiratory, cardiovascular and musculoskeletal) into the performance potential without dwelling on how the performance/output is actually achieved. Beautiful in its simplicity we feel. Users might fall in love with this or may be critical. While our work is based on a deep understanding of physiology, our aim with the performance potential lies in practical application, bringing everything to a common denominator.
Q: Can I compute the Workout Reserve on my own?
A: Yes, have a look at the formulas in the pre-print paper (Zignoli 2023) at this link: they can be easily implemented in an Excel spreadsheet.
References
Zignoli A. (2023), A reasonable alternative to the Wbal models when maximal mean power profiling is used instead of critical power-based models, Sportrxiv. DOI: https://doi.org/10.51224/SRXIV.244
Puchowicz et al. (2020), Development and field validation of an omni-domain power-duration model, J Sports Sci. DOI: 10.1080/02640414.2020.1735609
Andrea’s bio: Andrea works as a data scientist for Athletica and Supersapiens. He conducts research at the University of Trento, Department of Industrial Engineering, as a fellow researcher. You can read more about Andrea’s work here.

